6. Reports and history#
NavBar → Reports holds two different kinds of thing. Printed reports (Batch Report, Usage, Batch History, Alarm History, Inventory, Formula, Shift Consumption, Data Entry, Viscosity, and most of the rest) all work the same way: filters on the left or across the top (usually a date range, sometimes a tank filter), a Preview button that renders the report on screen, and a Print button that sends it to the LCP's printer. Interactive boards (Insights, Trending, Tank/CIP Board, Batch Queue Board, Alarm Summary, Operator Audit Trail, Golden Batch Overlay, Downtime/ OEE) are live screens with their own buttons and no Preview step — each is described below, in its own place, with what makes it different. The base printed-report mechanics — how the date range works, how Preview and Print behave — are covered step-by-step inside the app at Help → Operator Runbook §7 (source: OPERATOR_TRAINING_RUNBOOK.md in the Ring repository) and are not repeated here. This chapter instead goes report by report: what question each one answers, its filters, its printed columns, and how to read the result.
Start here: which report answers my question#
| Your question | Report | Where it lives |
|---|---|---|
| Where is batch #____, or which batch used formula X? | Go to Batch | Ctrl+B, anywhere |
| What exactly happened on this one batch? | Batch Report | Reports → Batch |
| How much of an ingredient did we use in total? | Usage Report | Reports → Batch |
| Did anything run overnight, or how many batches this week? | Batch History Report | Reports → Batch |
| Batch History, but with full ingredient detail per batch | Batch History Usage Report | Reports → Batch |
| What is planned to run next? | Batch Queue Board | Reports → Batch |
| Is this batch's temperature normal compared to past good batches? | Golden Batch Overlay | Reports → Batch |
| What fired overnight? | Alarm History | Reports → Alarms |
| Which alarms are the biggest problem, and are we improving? | Alarm Analytics | Reports → Alarms |
| Was a batch running when this alarm fired? | Alarm ↔ Batch | Reports → Alarms |
| What needs attention right now? | Alarm Summary | Reports → Alarms |
| Who did what, and when, on this station? | Operator Audit Trail | Reports → Alarms |
| What did inventory look like at a past event? | Inventory Report | Reports → Inventory & Formula |
| What does formula X's recipe look like right now? | Formula Report | Reports → Inventory & Formula |
| How much did each shift use? | Shift Consumption | Reports → Inventory & Formula |
| What did operators log by hand, and when? | Data Entry Report | Reports → Inventory & Formula |
| What's our cost, yield and giveaway looking like? | Insights | Reports → Process & Trends |
| What did this PLC tag do over the last few minutes/hours? | Trending | Reports → Process & Trends |
| Recorded per-tank temperature/level history | Tank History | Reports → Process & Trends |
| What has this formula's viscosity looked like over time? | Viscosity Report | Reports → Process & Trends |
| What did this storage tank's level and temperature do over a date range, shift by shift — and which batches ran on it? | Storage Tank Trends | Reports → Process & Trends |
| Which tanks are due for cleaning? | Tank / CIP Board | Reports → Process & Trends |
| How much did downtime cost us, and why? | Downtime / OEE | Reports → Process & Trends |
| I need the raw data in Excel | Exporting data | Reports → Data, or Setup |
Batch reports#
Go to Batch#
Ctrl+B from anywhere. Question answered: "where is batch #____, or
which batch used formula X?" A search box plus a results grid (Batch #,
Tank, Formula, Start, Status); double-click or Open jumps straight into
that batch.
Batch Report#
Question answered: "what exactly happened on this one batch?" Pick a date range to find the batch, then select it from a list; a summary panel shows the batch's header fields, and the printed detail table lists Op Code, Operation, Recorded, Actual Amount, Calc Amount — one row per ingredient event. Read the Actual vs. Calc columns together: a large gap between them on one ingredient is the first thing to check if a batch's final numbers look wrong.
Usage Report#
Question answered: "how much of ingredient X did we use, in total, over a date range?" Filters: date range, optional tank. Two printed tables: a per-family summary (Family, Count, Actual Amount, Calc Amount) and a per-operation breakdown (Op Code, Operation, Count, Actual Amount, Calc Amount). Use this instead of Batch Report when you want a total across many batches rather than one batch's detail.
Batch History Report#
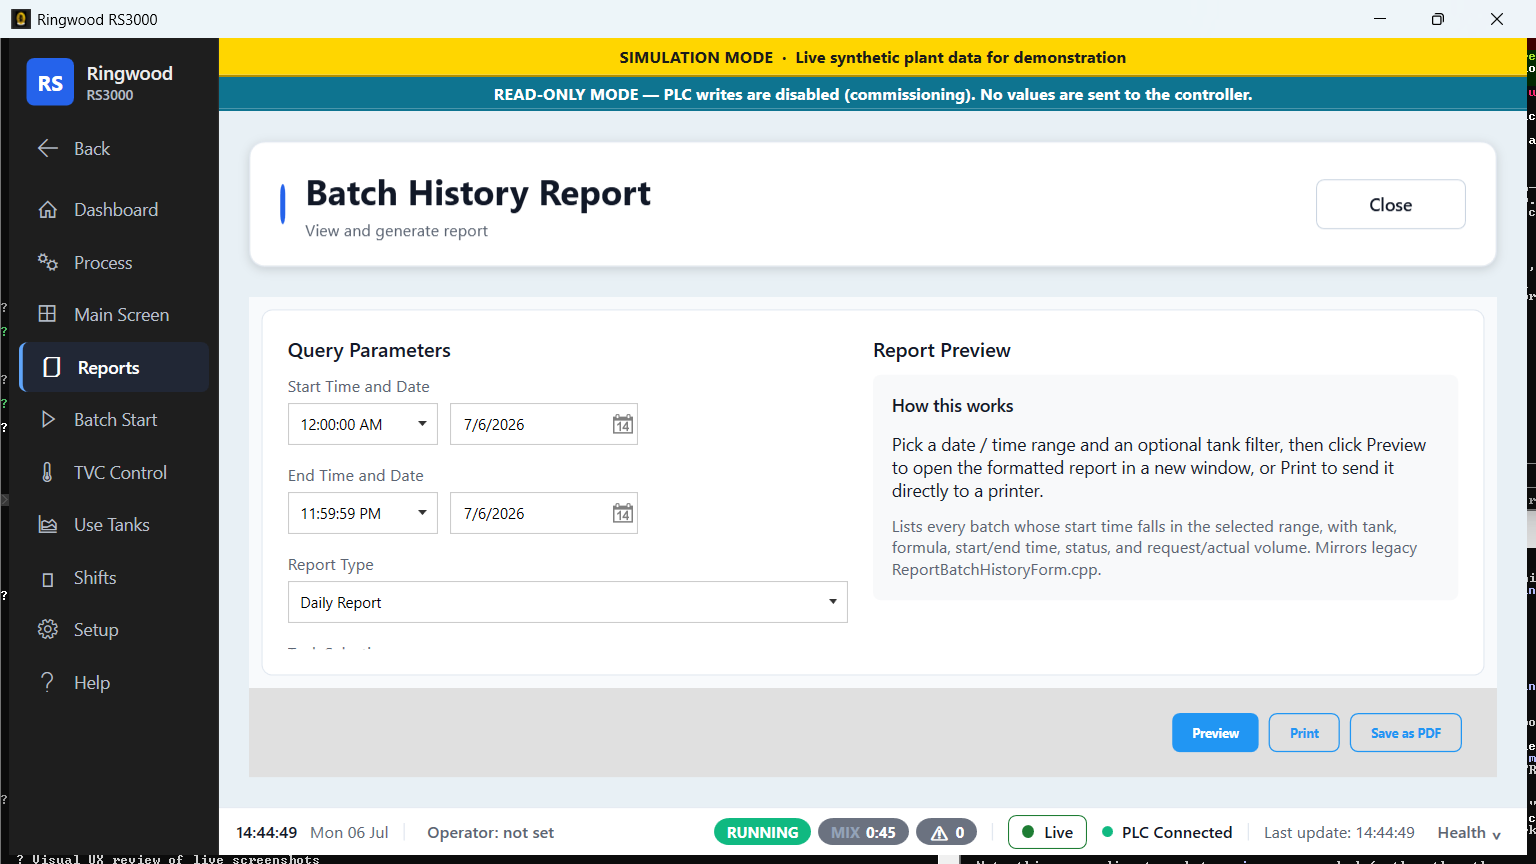
Question answered: "what batches ran in this window, and how did each one end?" One row per batch: Batch #, Tank, Formula, Start, End, Status. This is the fastest way to answer "did anything run overnight" or "how many batches did we do this week."
Batch History Usage Report#
Question answered: the same window as Batch History, but with each batch's full ingredient detail underneath it — one batch header per batch, then its own Op Code, Operation, Recorded, Actual Amount, Calc Amount sub-table. Use this when you need Batch History's coverage but Batch Report's level of ingredient detail, for more than one batch at a time.
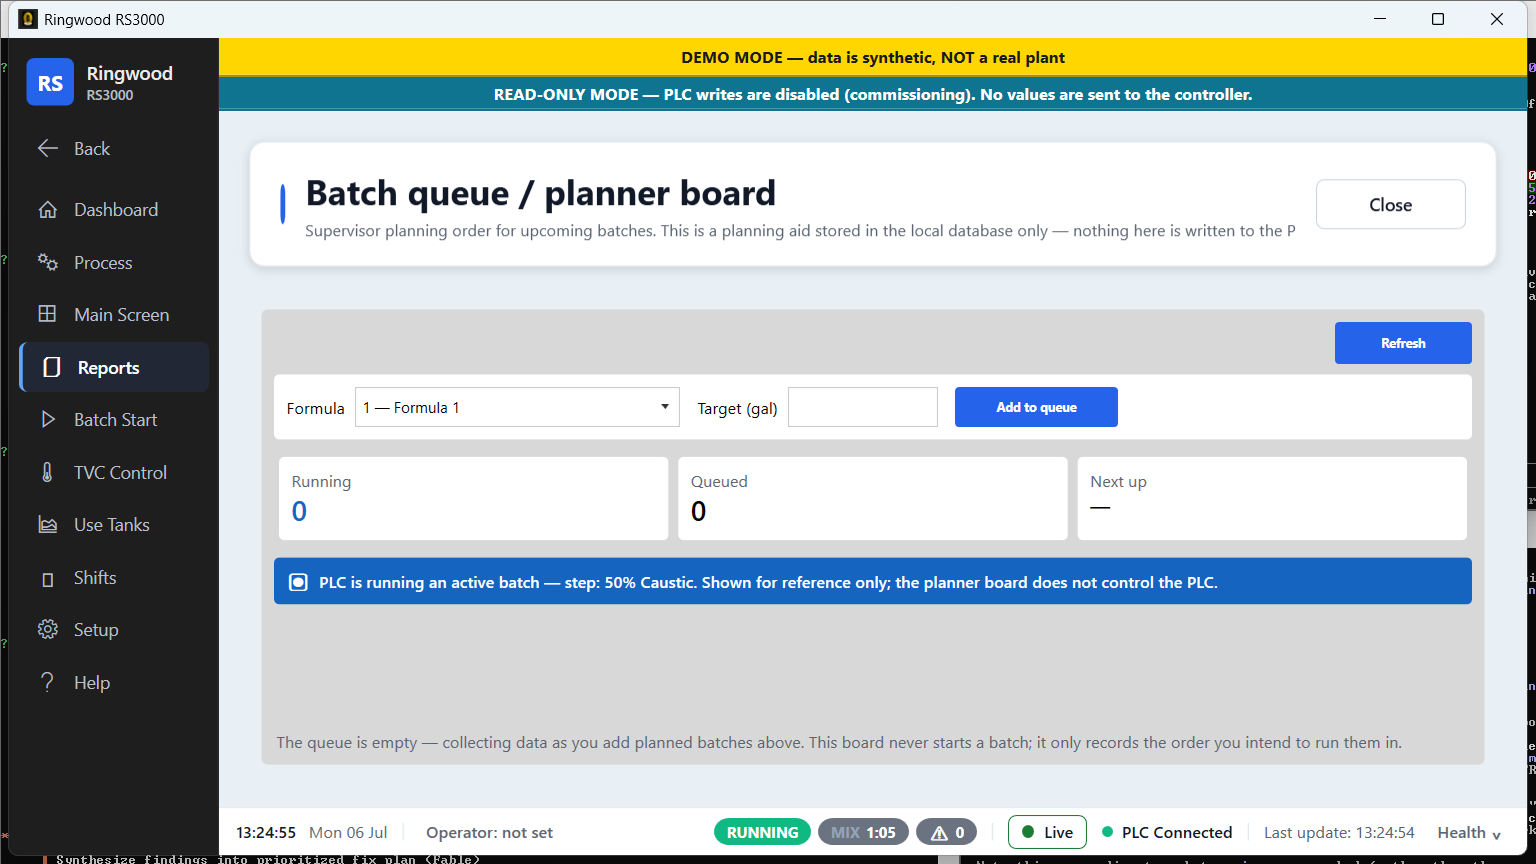
Batch Queue Board#
Question answered: "what is planned to run next, and in what order?" This is a supervisor planning aid stored in Ring's own database only — nothing on this board is written to the PLC, which alone owns what actually executes, and each row's target size is a reference figure, not a live controller value. The board shows KPI tiles (Planned/Running, Queued, Next Up), a form to add a planned batch (tank, target gallons, Add to Queue), and a Mark Done button per row once a planned batch has actually run.
Golden Batch Overlay#
Question answered: "is this batch's temperature tracking normally compared to past good batches of the same formula?" Pick a tank; the screen shows the live or selected batch's temperature curve overlaid on a reference "golden" curve built from a configurable number of past reference batches, plus Current Deviation, Max Deviation, and a plain status readout. When there is not yet enough history to build a reference curve, it says so plainly rather than drawing a fabricated line — a "collecting data" state, not a flat zero line.
Alarm reports#
Alarm History#
Question answered: "what alarms fired (and cleared) in this window?" Columns: Alarm #, Description, Alarm Date/Time, Ack Date/Time. Filter by date range only. This is the report to run for "what fired overnight" at shift handover.
Alarm Analytics#
Question answered: "which alarms are the biggest problem, and are we getting slower or faster at responding to them?" Two tables over a date range: a frequency Pareto (Alarm #, Name, Count, Cumulative % — read top-down, the alarms responsible for most of your alarm volume are at the top) and a nuisance-alarm ranking (Alarm #, Name, Count, Median Active, Score — a high score combines high frequency with long time spent active, so it surfaces alarms that are both frequent and slow to clear). MTTA (mean time to acknowledge) and MTTR (mean time to resolve) summarize response speed for the range.
Alarm ↔ Batch#
Question answered: "was a batch running when this alarm fired?" Columns: Time, Alarm #, Alarm, Type, Batch(es) running — useful for tracing whether a quality issue on a specific batch coincided with a fault.
Alarm Summary#
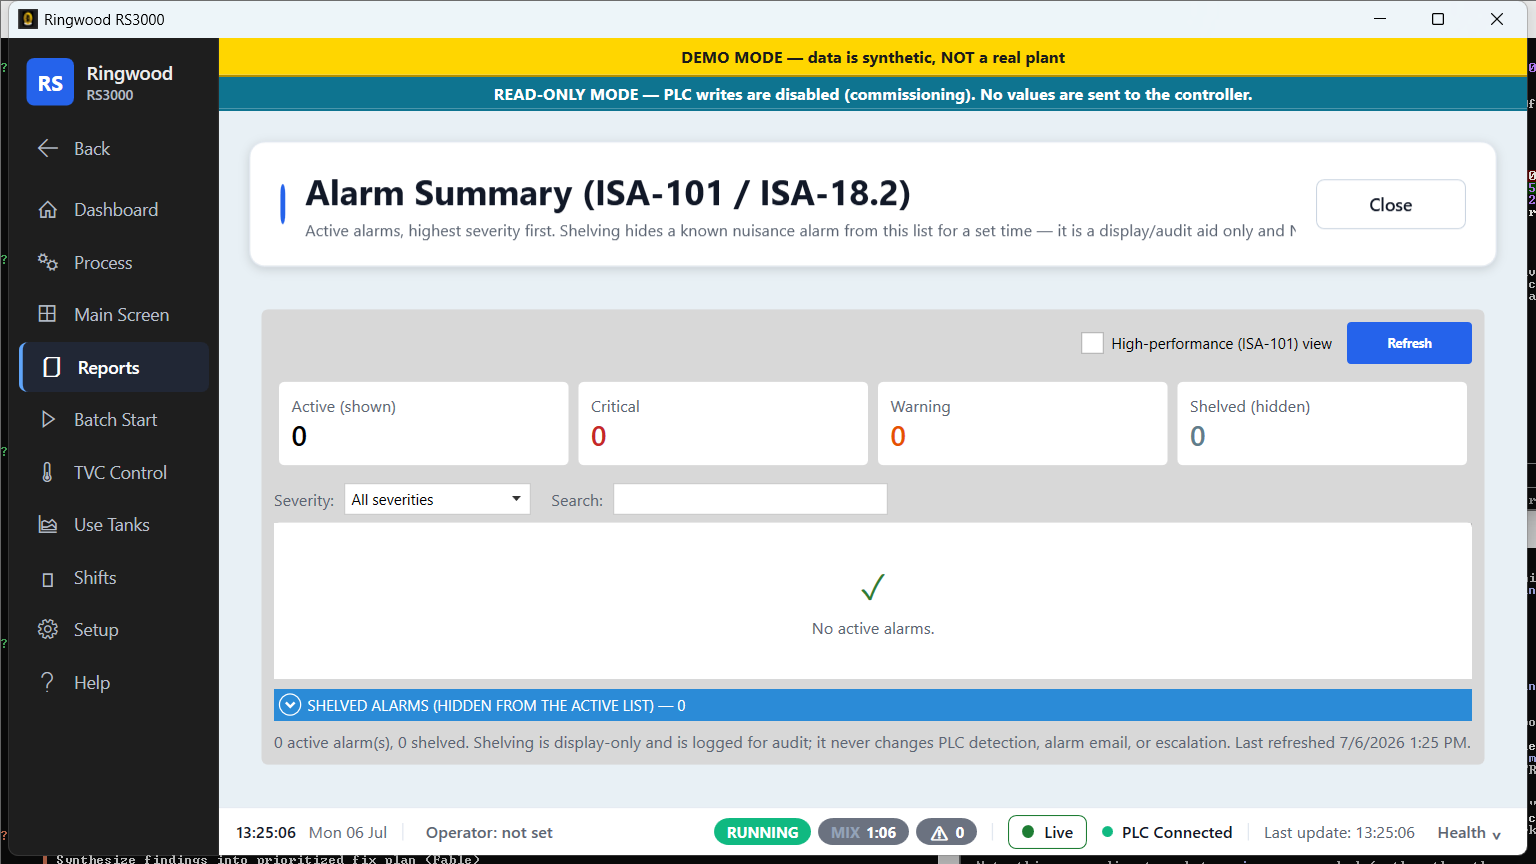
Question answered: "what needs attention right now?" — a live, ISA-101/ISA-18.2-style view of active alarms, highest severity first. Columns: Sev, Severity, No., Description, Raised, Age, Action. A separate, collapsed Shelved alarms section lists any alarm currently hidden from the active list (No., Severity, Description, Reason, By, Until, Action) — shelving is a display/audit aid only and never changes PLC detection, alarm email, or escalation; a shelved alarm that is still genuinely live is flagged in its own hiding-a-live-alarm note rather than disappearing silently.
Operator Audit Trail#
Question answered: "who did what, and when, on this station?" A read-only, chronological record: Time (local), Operator, Screen, Control, Action, Old, New, Detail. Nothing here is sent to the PLC, and each record is chained to the one before it specifically so an altered or deleted record would be detectable — treat this as the record of record. The Operator column is whichever name was picked in the status strip at the time — see 01-getting-started.md §Tell Ring who you are.
Inventory and formula reports#
Inventory Report#
Question answered: "what did inventory look like at each recorded event?" A list of inventory events (Event ID, Date) on the left; select one to print/preview its detail — an ingredient-by-ingredient breakdown (Ingredient, Quantity, Unit) for that event.
Formula Report#
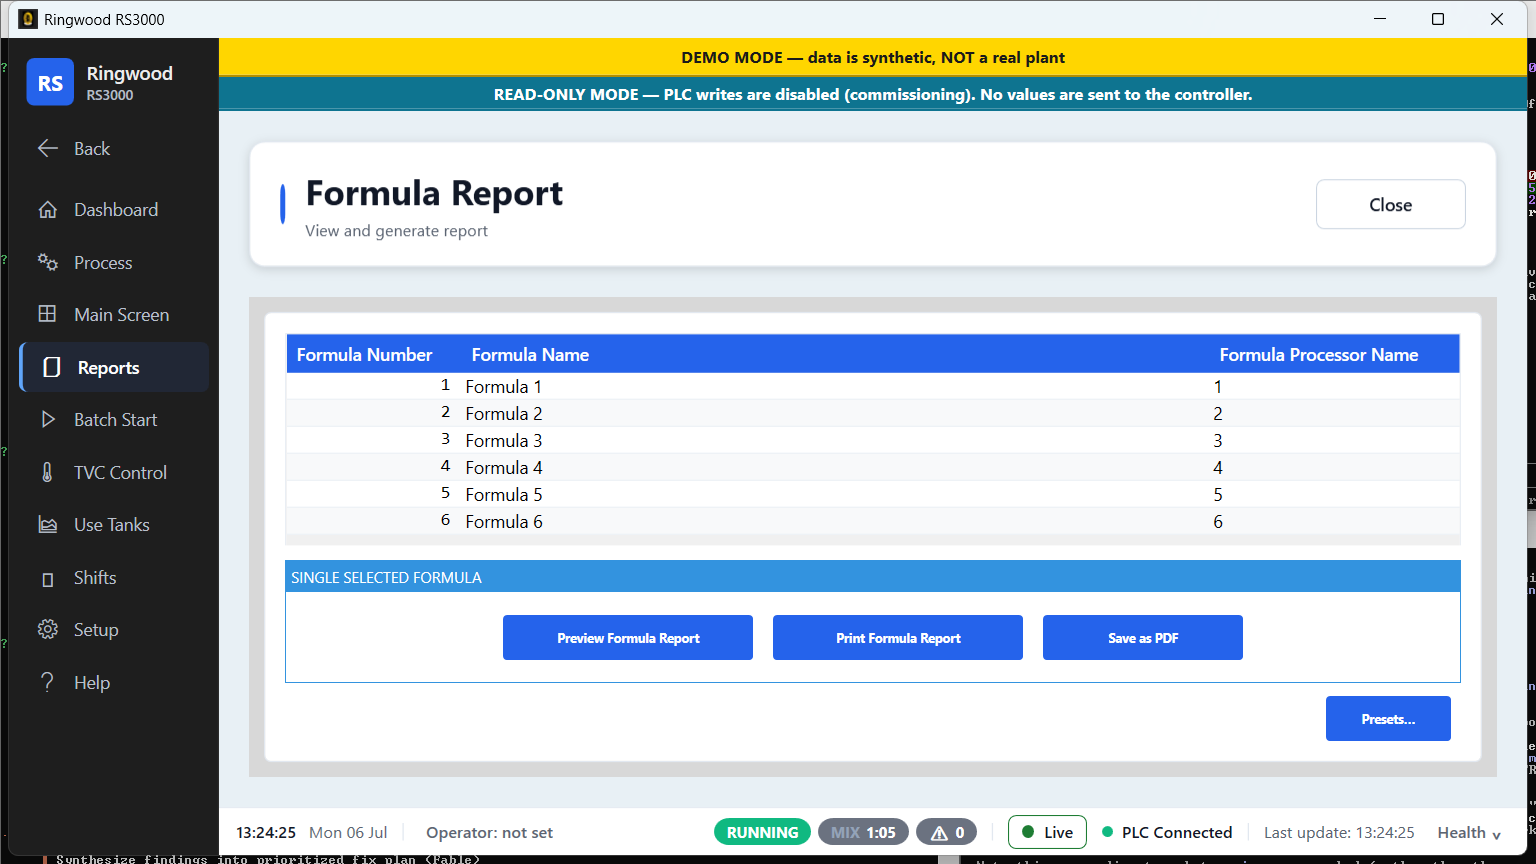
Question answered: "what does formula X's recipe look like right now?" No date range — this is a current-state report. Pick one formula from the list (Formula Number, Formula Name) to print its full step detail, the same shape as the Formula Edit screen's table.
Shift Consumption#
Question answered: "how much did each shift use?" A per-shift summary (Shift ID, Shift Name, Start Time, Start Date, Duration, Consumption) with a per-operation breakdown underneath each shift (Operation, Uses, Consumption).
Data Entry Report#
Question answered: "what did operators log by hand on this station, and when?" Filters: date range, plus a picker for which of the five Setup → Data Entry screens to report on (their field labels are renamed per plant under Setup → Data Entry Setup — see 3b §Data Entry and Data Entry Setup). Preview or Print the formatted result the same way as any other report.
Process and trends#
Insights#
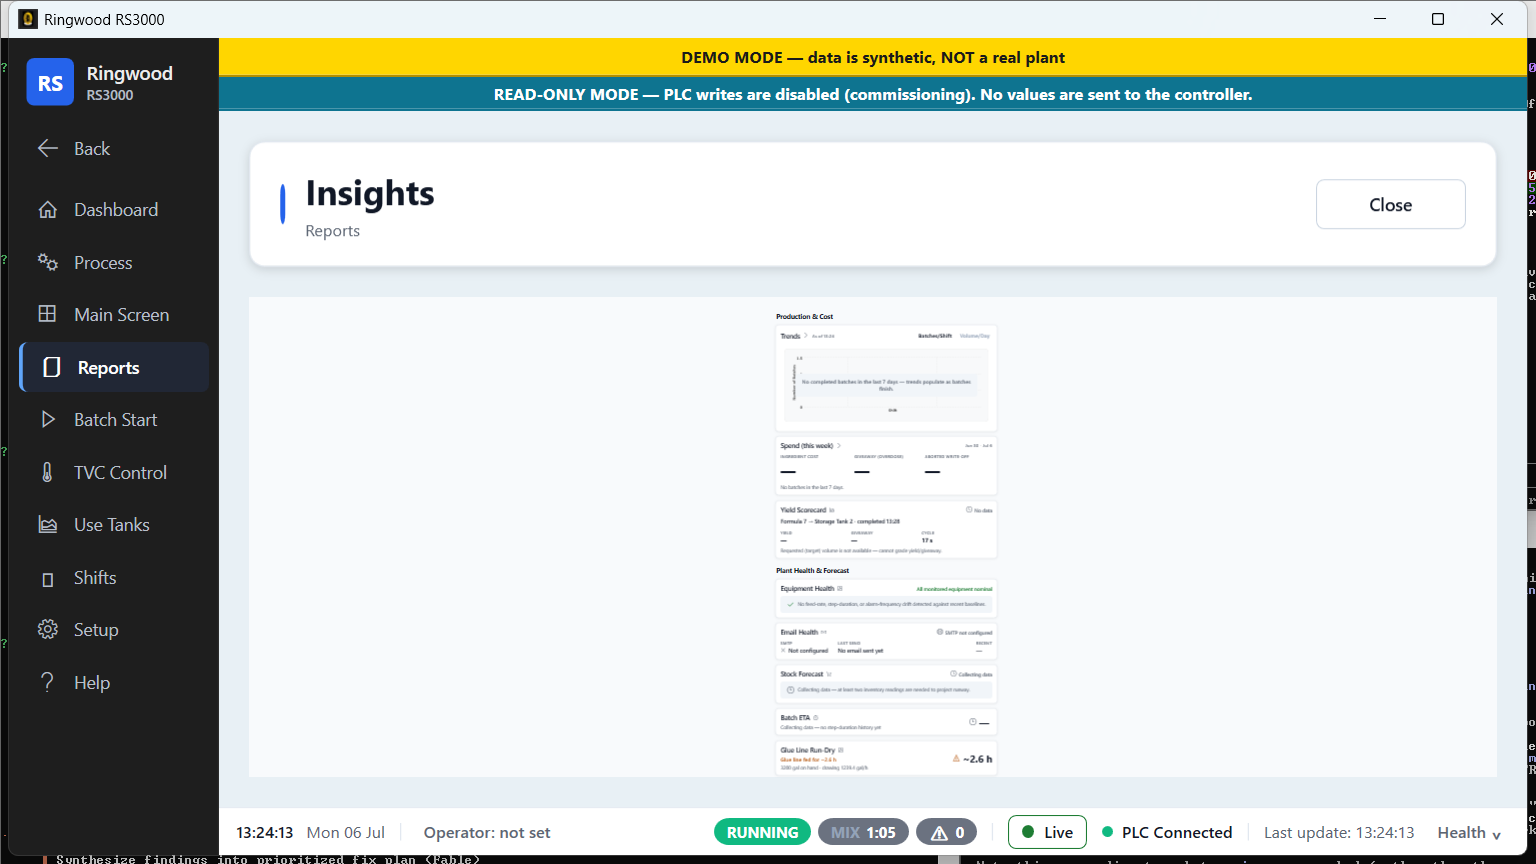
Reports → Insights is the plant's cost/yield dashboard — see Spend, yield and usage below.
Trending#
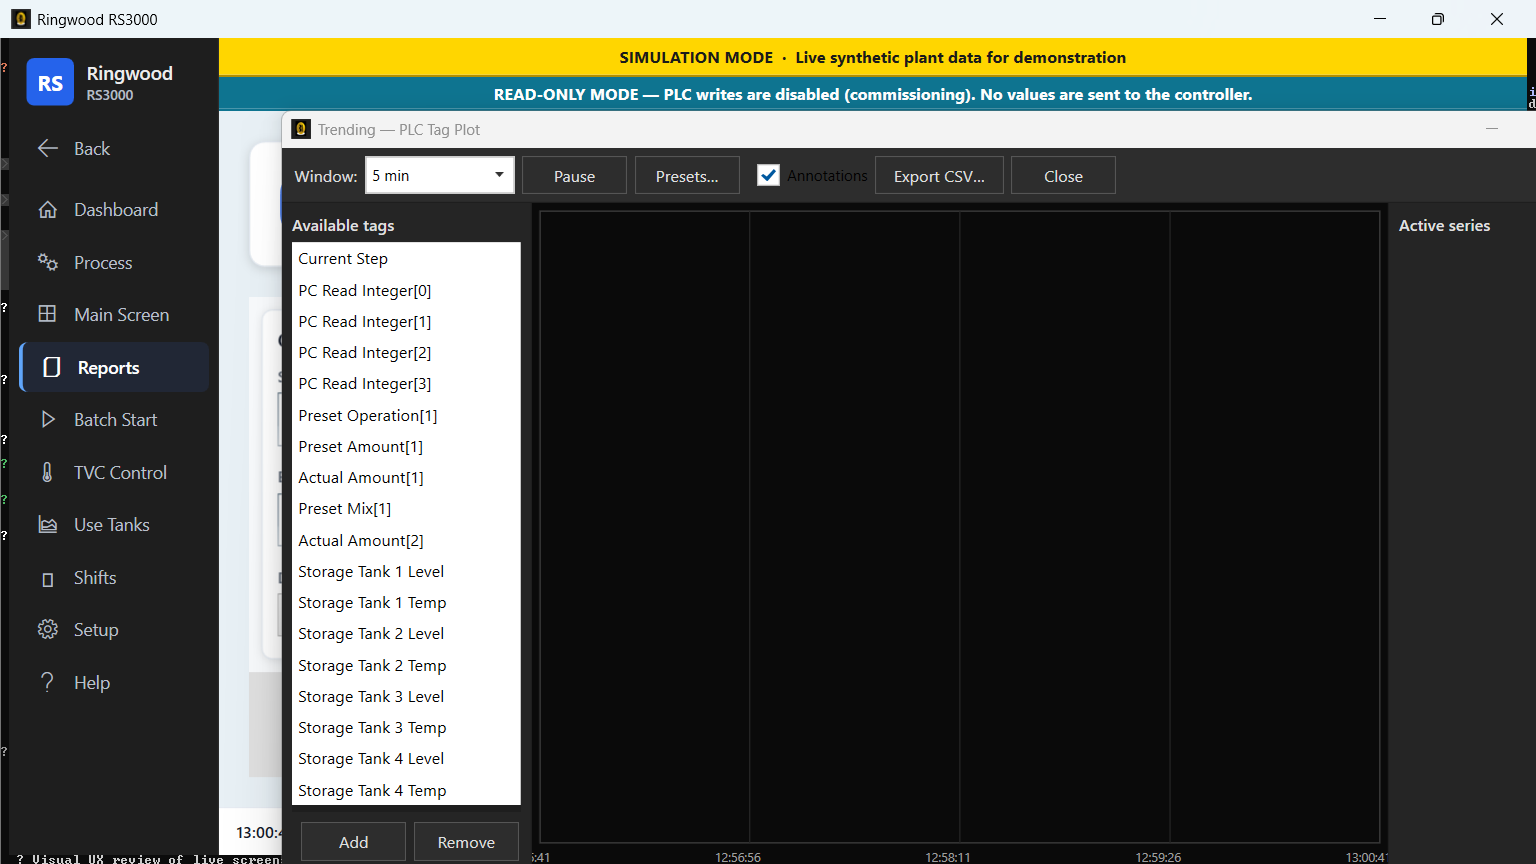
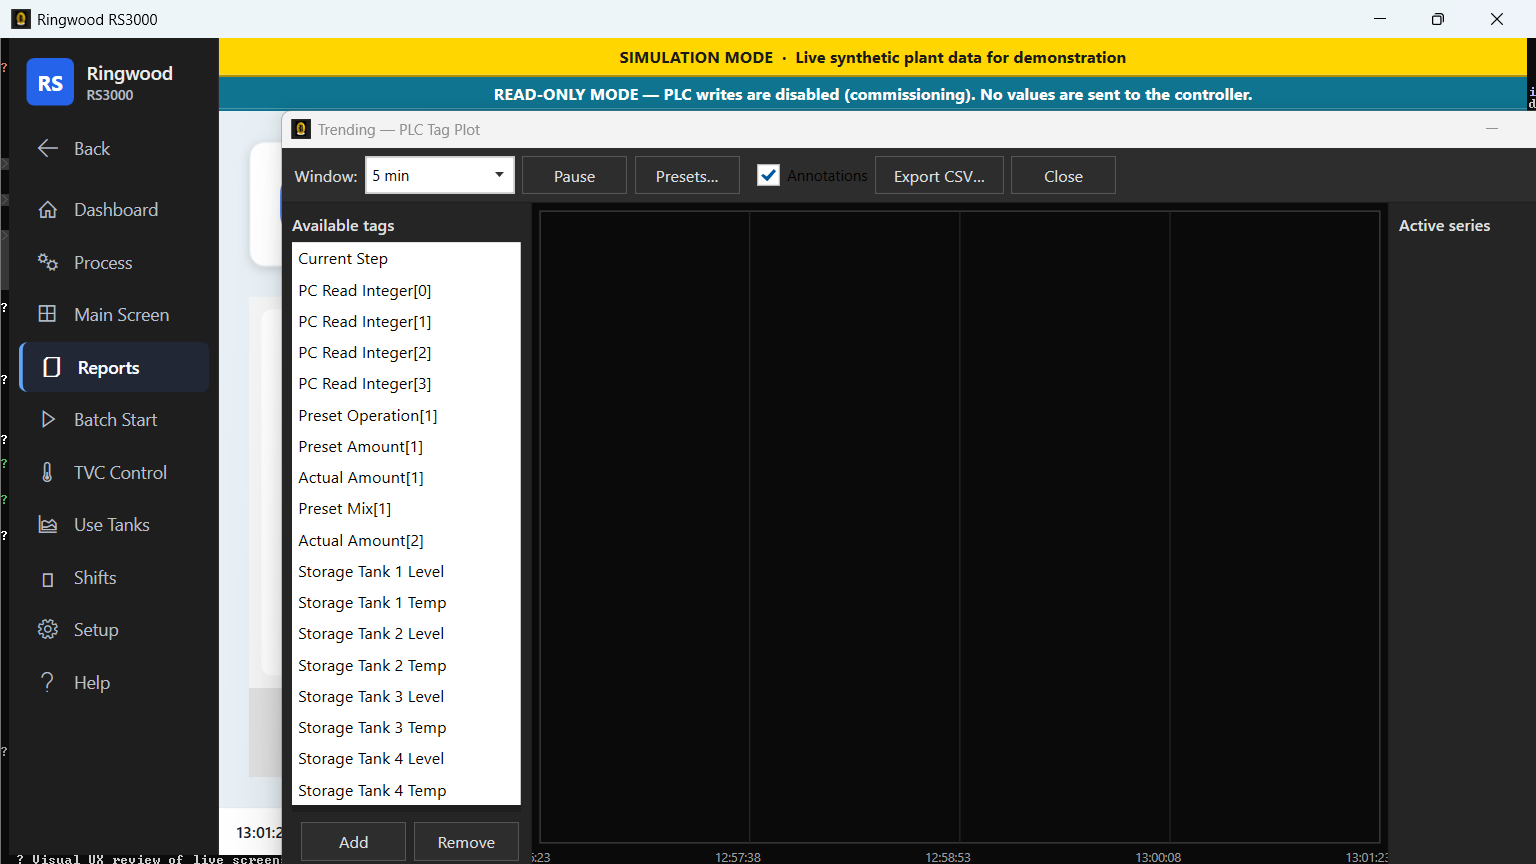
Question answered: "what did this PLC tag actually do over the last few minutes/hours?" — a live rolling plot, not a historical report; there is no date-range filter because it only shows what has happened since you opened it (or since the plot buffer started). Pick from the station's tag registry: ten fixed controller tags (Current Step, PC Read Integer[0]– [3], and several of the live batch-array tags — Preset Operation, Preset Amount, Actual Amount, Preset Mix) plus a Level and a Temperature series for every storage tank on your roster — so a 4-tank plant offers 18 series in the picker, a 6-tank plant 22. Add up to as many as you want to the plot with Add/Remove, choose a time window (5 min, 30 min, 2 hr, or 8 hr), toggle Annotations, and use Pause/Resume to freeze the plot for a closer look. Export CSV saves what is currently plotted. Named Presets let you save a tag+window combination for reuse. Hovering the chart shows a crosshair with the exact value at that point in time.
Note: The small Trend button on a Storage Tank Group card opens Trending with that tank's Level and Temperature series already selected — you do not have to find them in the picker yourself.
Note: Some Trending series (the batch preset/actual amount tags) deliberately show no unit label on the axis. The underlying PLC tag carries no unit of its own, and — per the settled pounds verdict (see 05-formulas-and-recipes.md) — labelling it is a follow-up step pending a separate sign-off. Read these series as relative shape over time, not as a labelled absolute value.
Tank History#
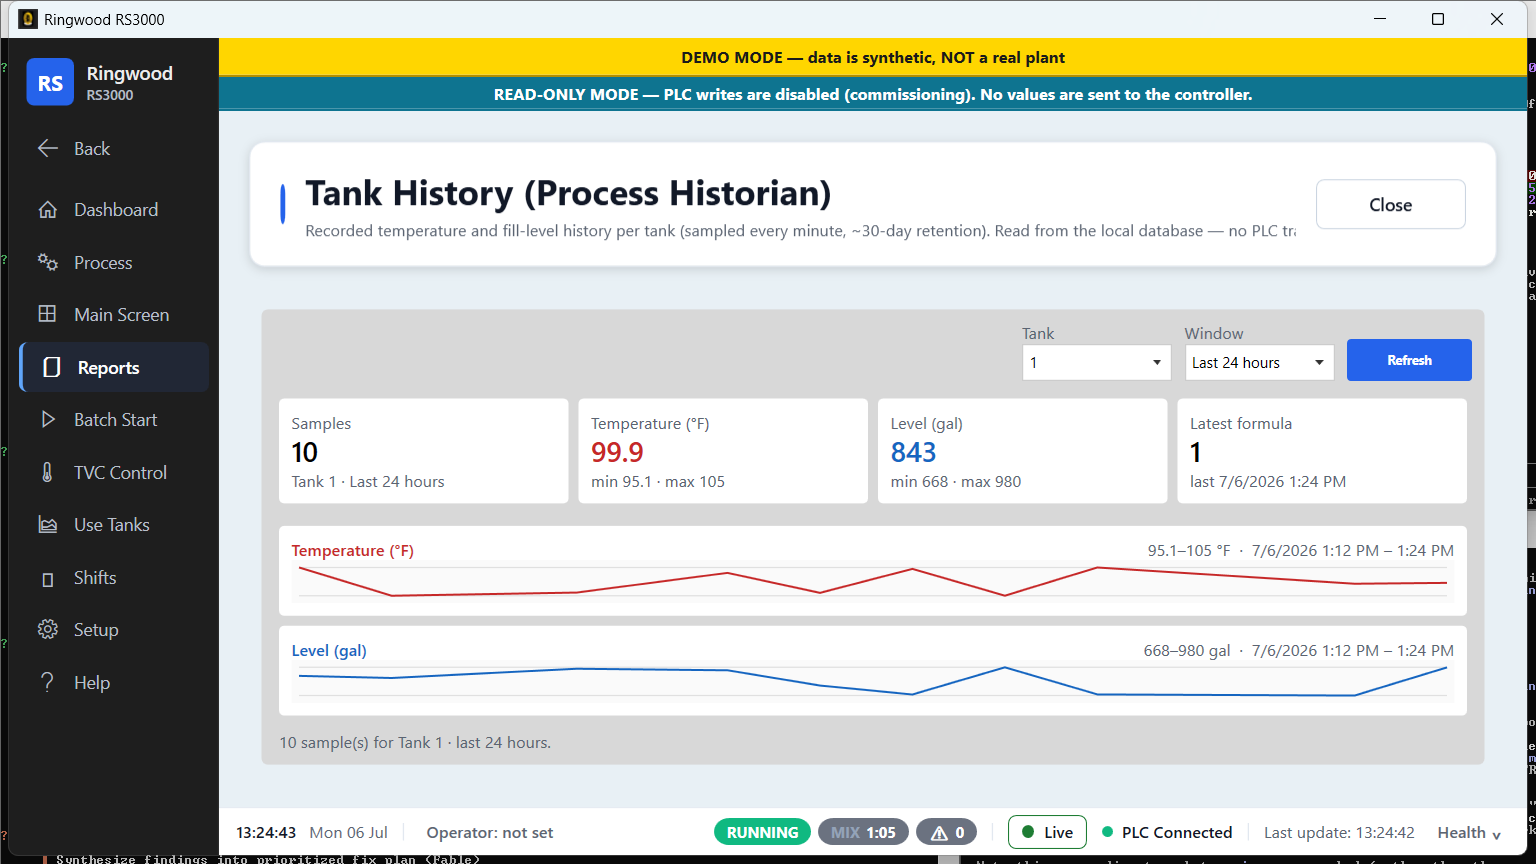
Recorded per-tank temperature/level history — a historian view distinct from Trending's live plot.
Viscosity Report#
Question answered: "what has this formula's viscosity looked like over time?" Columns: Recorded (UTC), Formula, Storage Tank, Current Temp, Raw, Calibrated, Operator — the same readings logged from the Viscometer screen (see 03a-main-screen-reference.md §Viscometer), gathered into one report.
Storage Tank Trends#
Question answered: "what did this storage tank's level and temperature do over a date range, and what happened shift by shift — min/avg/max level and temperature, and which batches ran on it?" Filters: a date range (start/end date plus time-of-day, defaulting to the last 7 days), an optional Shift filter (All Shifts, or one installed shift — picking a specific shift restricts both the trend chart and every table row to that shift's recurring window across the whole date range, including its overnight tail), and a Tank filter (All Tanks, or one storage tank — picking one tank also draws its level/temperature trend chart; All Tanks shows the aggregate table only, with no chart, since overlapping traces for every tank would be unreadable).
The per-shift aggregate grid: Tank, Shift, Date (the local date the shift occurrence began — an overnight shift is dated on the day it opened, not the day it crossed midnight), Samples, Temp Min/Avg/Max, Level Min/Avg/Max, Batches (a count; selecting a row lists that occurrence's batches — ID, formula, started, status — in the grid below it).
Data comes entirely from the Process Historian (level/temperature already recorded automatically about once a minute per tank, retained for 365 days by default — see How long report data is kept below) plus the Batch table — this report adds no new PLC reads of its own.
Honesty behavior: if the date range you pick starts before the historian's very first recorded sample, the screen states "Recording of storage tank history began <date>" instead of quietly showing a misleadingly empty range. Any missing figure — a period the historian was offline, for example — shows as an em-dash, never a fabricated zero.
Export: Preview/Print and Save as PDF render the on-screen, localized, current-display-unit version. Save as CSV is deliberately different — invariant English headers, native units (°F / gallons regardless of the on-screen toggle), and ISO-8601 UTC timestamps — a machine-readable export, not a copy of what's on screen.
Tank / CIP Board#
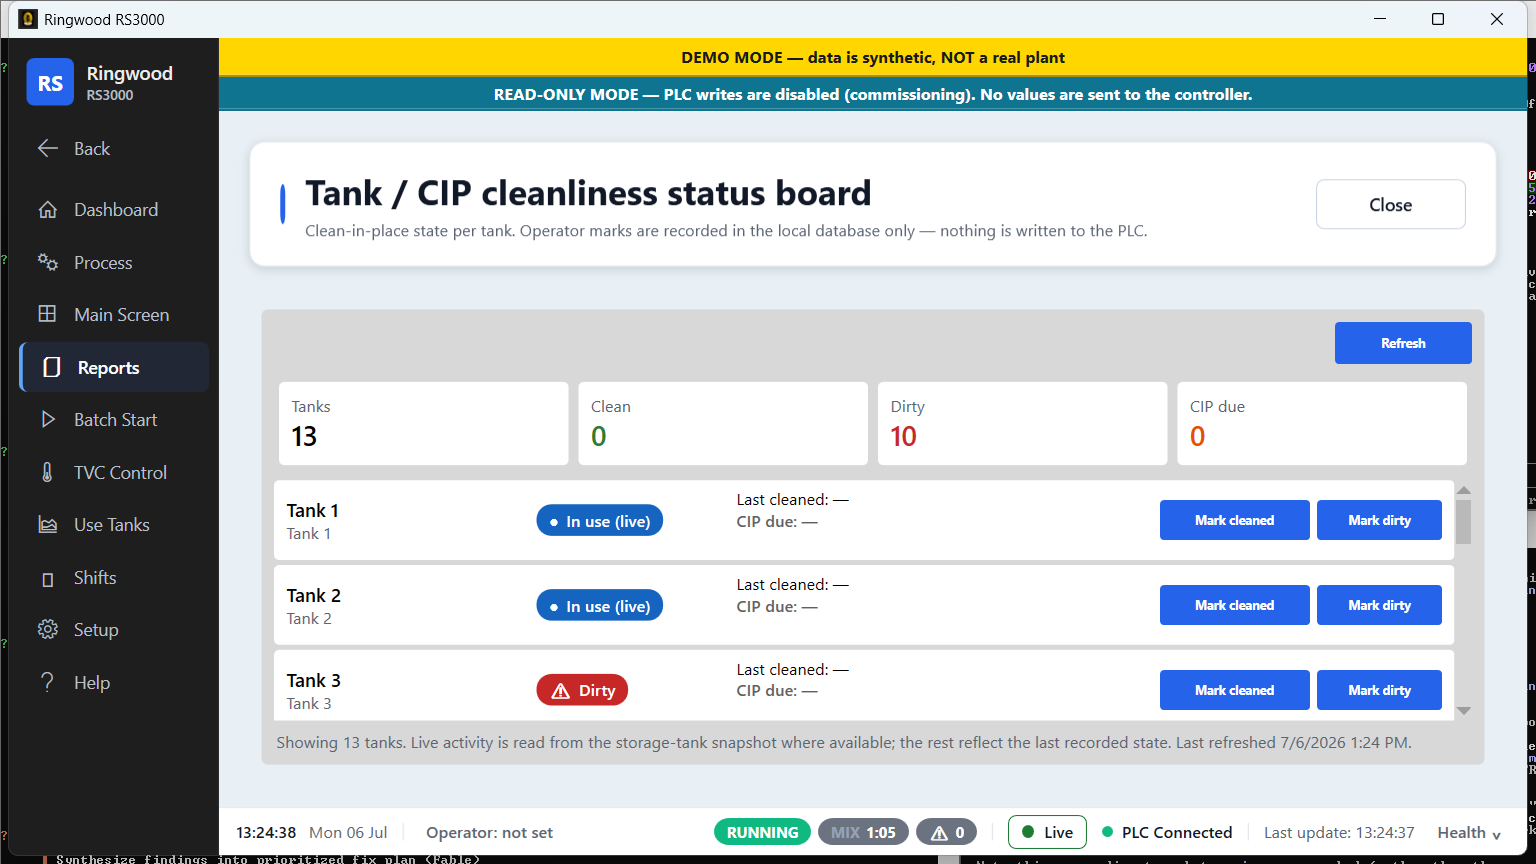
Question answered: "which tanks are due for cleaning?" Clean-in-place state per tank — tile counts for Clean, Dirty, and CIP Due, with Mark Cleaned / Mark Dirty buttons per tank. Operator marks are recorded in the local database only — nothing here is written to the PLC.
Downtime / OEE#
Question answered: "how much did downtime cost us, and why?" This report is built entirely from operator-logged downtime events — the plant exposes no reliable readable hold/stop tag Ring could read this from automatically, so the "Log downtime" panel is how the data gets in at all, and it is a non-blocking inline panel (never a modal that could freeze the floor). Once logged, the report shows total downtime, an estimated cost ($/hr × hours), an OEE Availability figure, and a downtime-by-reason Pareto (Reason, Events, Downtime, Cumulative %, Cost).
Golden Batch Overlay, Glue Usage Report, Dry lbs / sq ft, Cycle-Time Trend#
- Glue Usage Report — per-batch Batch #, Tank, Formula, Started, Solids %, Shift, plus derived dry-starch usage; per-formula and per-shift summary chips.
- Dry lbs / sq ft — joins the same derived dry-starch pounds to the operator-entered square footage from Shifts → Production Log, per shift occurrence: Shift, Date, Square Feet, Coverage Rate, Area per lb, Band, Note, Source, Entered By. Three honest states only — a real coverage figure, "no certifiable completed batch," or "no square footage entered" — a missing input is never shown as a zero.
- Cycle-Time Trend — a formula's median cycle baseline, a slowest-step ranking (top row is the bottleneck: Step, Operation, Samples, Median, % of cycle), and which steps in the most recent batch ran over baseline by more than a configured margin (Baseline, Observed, Over by). Zero samples renders an explicit empty state and an em-dash median, never an invented ranking row.
Spend, yield and usage — the Insights screen#
Reports → Insights is the plant's cost/yield dashboard, in two sections:
Production cost:
- A trend chart — batches-per-shift or volume-per-day.
- Glue Used — preset vs. actual dry-starch usage for today, this shift, this week, or a custom range, with a link into the full Glue Usage Report.
- Spend — ingredient cost, giveaway/overdose cost, and aborted-batch write-off cost, sourced from Setup → Costs.
- Yield Scorecard — yield, giveaway and cycle-time figures at a glance, with a fuller Yield/Giveaway breakdown underneath (by formula, by tank, over/under/on-target counts, mean delta, and weekly cost) — the same numbers behind the standalone Yield / Giveaway Report (Batch #, Tank, Formula, Requested, Actual, Giveaway, Yield %, Note).
- Batch ETA — a single honest line ("batch done in ~22 min") for the currently running batch, built from the median duration of similar past batches. When there isn't enough history for a real estimate, or the live batch data has gone stale, it says so instead of guessing — it never invents a number.
Plant health: Equipment Health and Alarm Load summaries, with a link into the full Alarm Analytics report.
Exporting data#
Reports → Database Export (Reports → Data group — it is not under Setup, and it is a different tool from Setup's Database Backup/Restore) exports any of six tables to CSV, with a column picker and, where the table has a meaningful timestamp, a date range:
| Table (as shown in the picker) | Date filter column | Notable columns |
|---|---|---|
| Mixer Batch | Start time | Tank, formula, level, start type, start/end time, status, actual volume, cost, notes, operator, controller batch number and outcome |
| Ingredient Usage | Recorded time | Batch ID, operation code/name, actual amount, calculated amount |
| Alarm History | Alarm active time | Alarm number/name/status/type, active/ack/resolved timestamps |
| Shift Definitions | (none — this is a configuration table, not an event log) | Shift number, name, installed flag, start time, duration |
| Inventory Snapshots | Captured time | Carryover, counter, formula number, per-slot amounts |
| Viscometer Settings | (none) | Per-formula calibration coefficients, alarm band, adjustment mode |
Click-by-click steps also exist inside the app at Help → Operator Runbook §7.7; the exported file opens directly in Excel.
Export everything (.sql)#
Alongside Export to CSV (which is limited to the six tables and columns
above), the same Database Export screen has an Export everything
(.sql)… button that ignores the table picker entirely. It asks only for a
destination folder (defaulting to your Documents folder), then writes a
single file named RingwoodDatabase-<timestamp>.sql containing the entire
database — every table's structure and every row, not just the six tables the
CSV picker offers. A result dialog reports how many tables and how many rows
total were written, plus the exact file path.
Hand this file to IT/support, or replay it into a brand-new empty SQLite
database to fully restore or inspect the data. It is a point-in-time snapshot
taken instantly and safely while Ring keeps running and writing to the
live database — you do not need to close Ring or wait for a quiet moment
first. If the export is interrupted (the app is closed, or power is lost)
partway through, no half-written .sql file is ever left behind under the
final name; at worst a same-named .sql.partial file remains, and that file
is safe to delete.
How long report data is kept#
Process-trend history (the Process Historian behind Tank History and Storage Tank Trends) and alarm history each have their own retention window, set independently under Setup → Database Backup/Restore → Data retention (supervisor-gated — see 3b §Setup). Both default to 365 days, and either can be set to 0 to keep records forever. A historian-retention change takes effect after Ring is restarted; an alarm-history-retention change applies immediately.
If a report's underlying database can't be read at all — not just empty of matching rows for your filter — the screen says so with an explicit "data unavailable" notice instead of quietly rendering a clean, misleadingly empty grid.
Sources verified#
Ring/Views/Reports/BatchReportWindow.xaml,Services/Reports/BatchReportDocument.csRing/Services/Reports/UsageReportDocument.cs,BatchHistoryReportDocument.cs,BatchHistoryUsageReportDocument.cs,InventorySnapshotReportDocument.csRing/Views/Reports/AlarmHistory.xaml,AlarmAnalyticsScreen.xaml,AlarmBatchCorrelationScreen.xaml,AlarmSummaryScreen.xaml,UiAuditTrailScreen.xamlRing/Views/Reports/InventoryReport.xaml,FormulaReport.xaml,ShiftConsumption.xamlRing/Views/Reports/InsightsScreen.xaml,TrendingScreen.xaml,TrendingScreen.xaml.cs(:62-65 time windows, :75 Presets)Ring/Services/PLC/TrendingDataService.cs(:151-270 ten fixed tag definitions, thenBuildStorageSeries(StorageSeriesSlotNumbers())at :272-279 appends a Level+Temperature pair per roster storage slot)Ring/Views/Reports/StorageTankTrendsReport.xaml,.xaml.cs,Ring/Services/Reports/StorageTankTrendsQueryService.cs,StorageTankTrendsReportDocument.cs,Ring/Views/Reports/StorageTankTrendsCsvBuilder.cs,Ring/Models/StorageTankTrendsReportPayload.csRing/Views/Reports/TankCipBoardScreen.xaml,TankCipBoardScreen.xaml.csRing/Views/Reports/BatchQueueBoardScreen.xamlRing/Views/Reports/GoldenBatchOverlayScreen.xamlRing/Views/Reports/DowntimeOeeScreen.xaml.cs,YieldGiveawayReport.xaml.cs,GlueUsageReport.xaml.cs,DryLbsPerSqFtScreen.xaml.cs,CycleTimeTrendScreen.xaml.cs,ViscosityReport.xamlRing/ViewModels/BatchEtaCardViewModel.csRing/Services/Export/DatabaseExportSchema.cs(exact table/column list)Ring/Services/Export/SqlDumpService.cs(DumpDatabase, the.partial→ atomic-rename sequence)Ring/Views/Setup/DatabaseExportForm.xaml.cs(ExportSql_Click— folder picker defaulting to Documents, output filename pattern, result dialog wording)Ring/Views/UserControls/NavBar.xaml(DatabaseExportButton— single instance, inside the Reports popup's Data group;DataEntryReportButton— Inventory & Formula group)Ring/Views/MainScreen/DataEntryHub.xaml,DataEntryForm.xaml,Ring/Resources/Strings/Strings.en.xaml(S.Scr.DataEntry*,S.Scr.DataEntryReport.*)Ring/Resources/Strings/Strings.en.xaml(report column headers and subtitles quoted above)Ring/Infrastructure/Configuration/AppSettings.cs(Database.ProcessHistorianRetentionDays,AlarmSettings.AlarmHistoryDays, both default 365, :360/:663)Ring/Infrastructure/Configuration/DataRetentionConfigWriter.cs(0 = keep forever; restart-required note for the historian value)Ring/Services/Reports/ReportDataUnavailableNotice.cs(the "data unavailable" wording shown instead of a clean empty grid)- OPERATOR_TRAINING_RUNBOOK.md §7, §7.7 (referenced, not link-quoted)