4. Alarms and attention#
Where alarms appear#
An alarm shows up in several places at once, not just one screen:
- A full-window overlay appears on top of everything — a red beacon icon, the alarm's summary, and a description — and blocks navigation behind it while a fault is physically present. Clicking outside it does nothing. Continue Monitoring — or pressing Esc, which does exactly the same thing — dismisses it; either way is a display-only dismiss that does not silence anything on the controller. The embedded alarm grid inside the overlay (the same Process → Alarms screen, hosted in-place) lets you silence right there if you need to. If the PLC link drops while this overlay is up, it adds its own notice ("PLC link lost — alarm state is stale, last update HH:mm:ss") so a comms-loss-induced "everything shows Resolved" state can never be mistaken for the fault having actually cleared. A fixed 120-second cooldown per (alarm, base) pair stops the same still-unresolved fault from instantly re-summoning the overlay the moment you dismiss it — after those two minutes, if it is still unresolved, the overlay comes back on its own. A genuinely different alarm still summons it immediately.
- A compact red banner stays visible under the top-of-window safety banners on every screen while the fault is present — with a View button straight to the Alarms screen and a ✕ to dismiss the banner for now (it comes back the moment a new alarm raises; the count keeps showing regardless).
- The Dashboard's alarm band (see 03-screens-reference.md §The alarm band) states plant health in one line and lists active alarms.
- The bottom status strip, on every screen, carries a red alarm-count pill you can click to jump straight to the Alarms screen.
- Process → Alarms — the full alarm grid, described below.
- Optionally, an audible siren (if the LCP has speakers) and a flashing taskbar entry — see Sound and taskbar flash below.
- Optionally, an email or webhook, if this station has alarm escalation turned on (see Email and escalation below).
Every alarm is also recorded permanently in the Alarm History report, regardless of whether you saw or silenced the popup.
Note: While Ring runs read-only, the overlay's Continue Monitoring button carries an extra read-only caption, and the embedded Silence button is disabled the same way it is everywhere else — see Silence vs. acknowledge below. The overlay itself still appears; only the silence write is affected.
Silence vs. acknowledge#
- Silence stops the audible siren. The alarm is still active and still in the log — silence means "I know about it, stop the noise." It changes the row's Status glyph to the amber "Silenced" state.
- Dismissing the overlay (Continue Monitoring, or Esc — there is no "X" on this screen) gets the modal out of your way without touching the controller. The same fault will not re-summon the overlay for 120 seconds; after that, if it is still unresolved, the overlay comes back on its own. A different alarm summons it immediately, regardless of the cooldown.
Dismissing the overlay writes a line to Ring's own application log (who dismissed it, which alarm, and the reason — Continue Monitoring button or Esc key) but is not itself a database record; the alarm's own fire/clear history is what the Alarm History report shows regardless (source: OPERATOR_TRAINING_RUNBOOK.md §10.2 in the Ring repository describes an older popup with a close button — the behavior above is what the shipped code actually does).
Note: While Ring is running read-only, the Silence action on the Alarms screen is shown disabled with a visible caption explaining why — silencing writes a bit to the controller, so it is gated the same as every other PLC write.
The Alarms screen (Process → Alarms)#
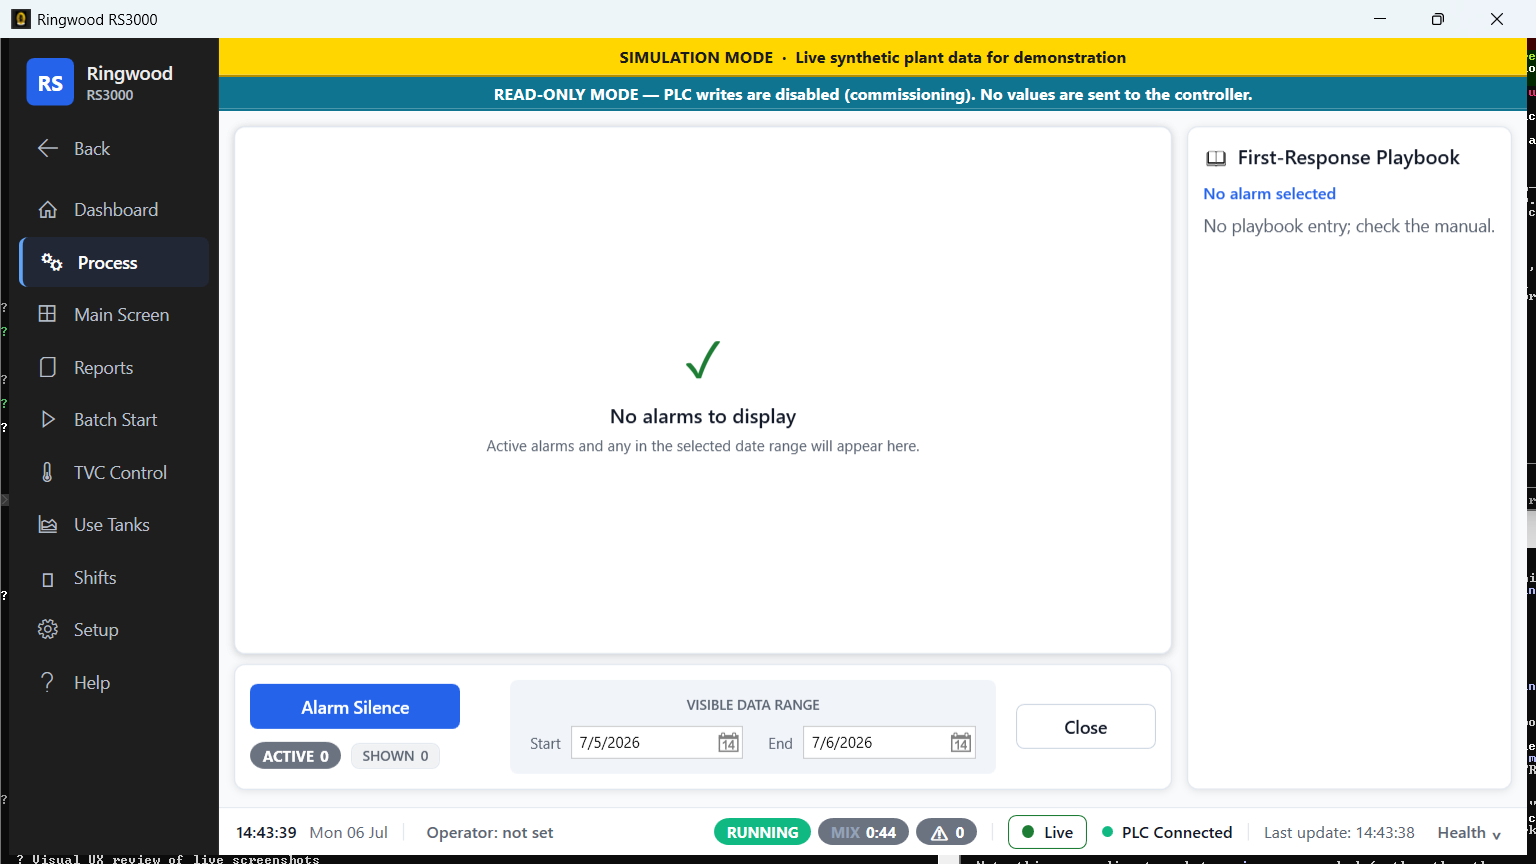
A full grid of every alarm currently known to the system.
Reading one row#
| Column | What it shows |
|---|---|
| Severity | A colored pill — Critical, Warning, or Info. |
| Triage badge | A "STOPS PRODUCTION" flag for Critical/Alarm-level rows only, plus a live "how long has this been active" age clock next to it. |
| Status | A shape-plus-color lifecycle indicator, deliberately never color alone: a red ▲ for Active, an amber ◑ for Silenced (the fault is still present — silencing only quiets the siren), a grey ✓ for Resolved (the fault actually cleared). |
| Alarm # / Description | The alarm's identity and text. |
| Go to | A one-tap link into the tank or system screen this alarm concerns — hidden when the alarm has no clean single-screen mapping (a plant-wide fault, for instance). |
| Raised / Acknowledged | Timestamps for when the fault fired and when it was acted on. |
A row for an active, unhandled alarm is shown in bold — weight alone carries the emphasis, deliberately not a larger font size, so every row still lines up on the same baseline. Resolved rows are dimmed to about three-quarters opacity so a page of cleared alarms reads calm, never like a wall of red.
The two empty states are not the same message#
If the grid is genuinely empty and the PLC link is healthy, a green all-clear message replaces it. If the grid is empty because the link is down, an amber "alarm data unavailable" message replaces it instead. These two are deliberately never merged into one "nothing to show" state — an empty list while the link is down is not an all-clear, it is a blind spot.
Filters and layout#
A date range filter narrows what's shown (useful for "what fired overnight"), and a first-response playbook panel on the right follows whichever alarm row you have selected — see below. A Silence button and an Active / Shown count pair sit at the bottom of the screen.
First-response playbooks#
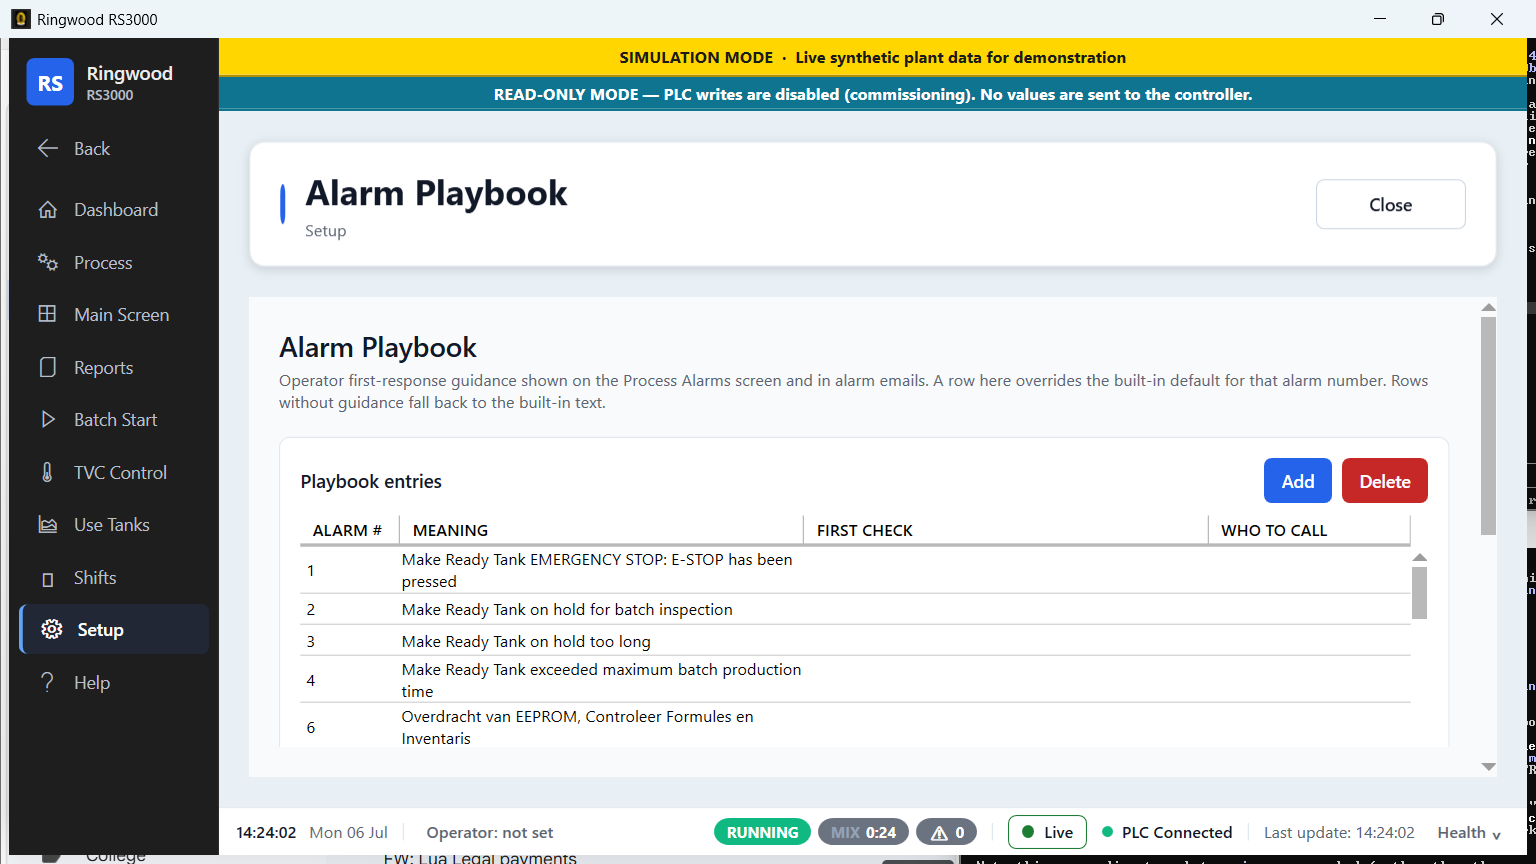
Selecting an alarm row on the Alarms screen shows a read-only panel with that alarm's entry from the plant's playbook: what the alarm means, the first thing to check, and who to call. This is populated and edited under Setup → Alarm Playbook Editor (supervisor-gated) — a table of Alarm Number, Meaning, First Check, and Who to Call, with a plain edit-and-save workflow. If an alarm has no playbook entry yet, the panel says so rather than showing nothing.
Note: The playbook panel is strictly a reference — reading it, or the Alarm Playbook Editor changing it, never touches the controller or the alarm itself. It exists purely so the "who do I call, and what do I check first" knowledge lives on the same screen as the alarm, instead of in someone's head or a binder on a shelf.
Tank attention#
The color-coded state ring on Main Screen → Storage Tank Group (green = idle, yellow = batching, red = fault — see 03a-main-screen-reference.md §Storage Tank Group) is the primary at-a-glance tank health indicator. On the Dashboard, a tank whose data has gone stale (PLC link down) visibly dims rather than continuing to look live — a frozen reading is deliberately made to look frozen so it is never mistaken for a current one.
Note: The codebase contains a ranked "tanks needing attention" strip that is not wired into any screen in the current build, so it is not documented here as something you can open — treat the state ring above as the authoritative at-a-glance indicator until/unless that changes.
Sound and taskbar flash#
Independent of email/webhook escalation, a new alarm can play a sound
(.wav, or the Windows exclamation sound as a fallback) and flash the
Ring.exe taskbar entry via Windows' own flash-window mechanism. This is
governed by its own on/off setting and an "only high severity" option, and
is debounced so a burst of alarms in quick succession does not turn into a
continuous noise. This mechanism is entirely separate from — and does not
require — the email/webhook escalation described next.
Email and escalation#
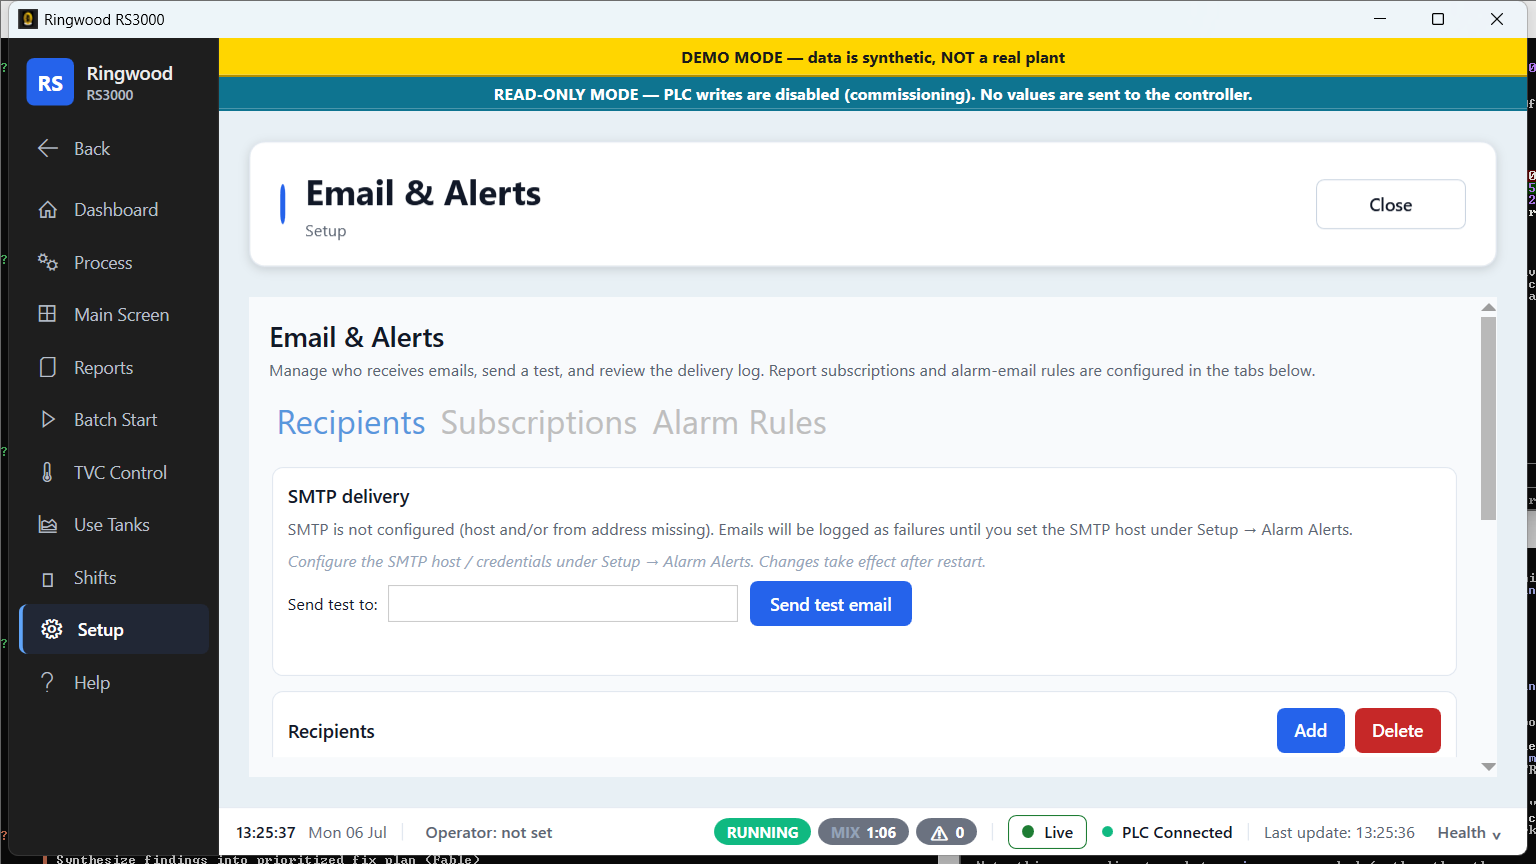
Setup → Email Alerts has two visible tabs:
- Recipients — the list of email addresses that receive alerts, SMTP delivery status, a Send test email button, and a delivery log (when, category, recipients, subject, delivery attempts) so you can confirm mail is actually going out.
- Subscriptions — report subscription management (separate from alarm email).
Alarm-triggered escalation is not configured on this screen — it lives in Setup → Alarm Escalation Settings, below. A third tab, Alarm Rules, exists in the code but ships hidden with an explicit comment against presenting an editor for it on the plant HMI (the underlying rule engine is live, but there is nothing yet to safely edit its rows from here) — if you never see it, that is by design, not a bug.
Setup → Alarm Escalation Settings controls whether an alarm triggers anything beyond the on-screen/audible notification. The escalation Mode is one of None (default — nothing is sent, alarms are log-only), Smtp (email, with host/port/credentials and a from/to list), or Webhook (a URL + HTTP method, with a Send test webhook button). A station ships with escalation off unless it has been explicitly configured.
Other notifications#
A small toast notification (bottom-right, non-blocking) reports a few other events, most notably "PLC reconnected" once the link comes back after being down — a quiet confirmation that you don't have to go hunting the status strip for.
Alarm Legend#
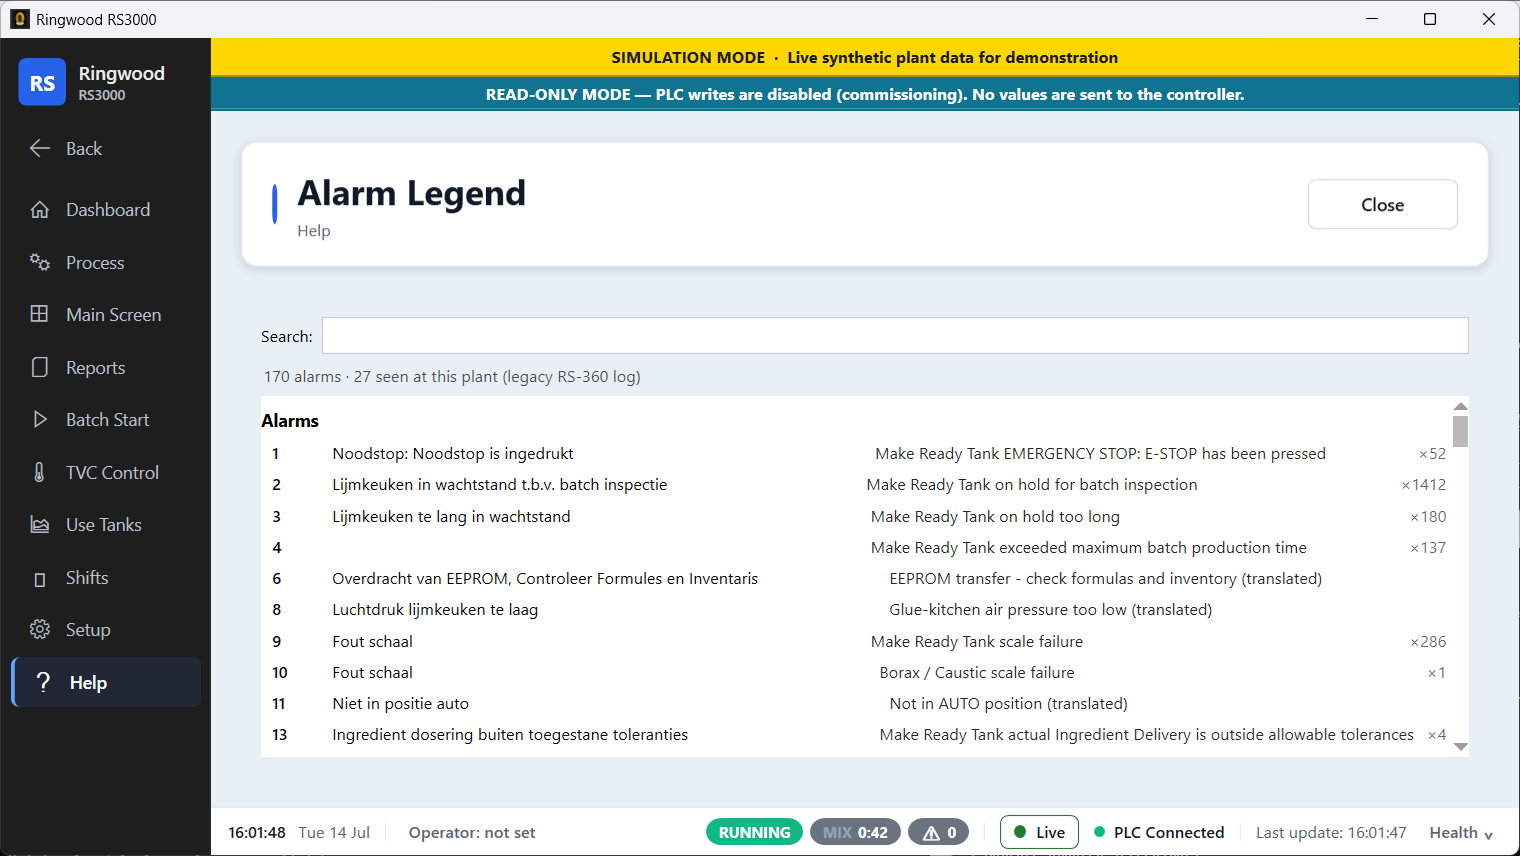
Help → Alarm Legend is a searchable, printable reference that decodes the controller's original Dutch alarm text against its English equivalent, side by side, with how many times each has occurred. Use it when an alarm description on the floor doesn't obviously match what's shown in Ring, or to print/save a PDF copy for the wall. This is independent of the app's own display-language setting (see 01-getting-started.md).
Reading a real alarm, start to finish#
Putting the pieces above together — this is what actually happens when the controller raises a fault:
- The full-window overlay appears immediately, with the beacon, the alarm's summary, and — inside it — the live alarm grid.
- If you have speakers and the sound is enabled, it plays; the taskbar entry flashes if Ring is not the focused window.
- You either Silence it from inside the overlay (quiets the siren; the row's Status glyph changes to the amber "Silenced" state — the fault is still Active underneath) or you clear the physical condition on the floor first.
- Once you are satisfied you know what is happening, click Continue Monitoring to dismiss the overlay — this never touches the controller, it just gets the modal out of your way. The compact red banner, the Dashboard alarm band, and the status-strip count pill all keep reporting it as long as it is Active or Silenced.
- Once the physical condition actually clears on the controller, the row's Status glyph moves to the grey "Resolved" check, and it dims on the Alarms screen. It stays in Alarm History permanently either way.
Sources verified#
Ring/Views/Process/Alarm.xaml(read in full — row/column shapes, styling)Ring/Views/Dashboard/DashboardView.xaml(alarm band)Ring/Views/MainWindow.xaml(full-window PLC alarm overlay, active-alarm banner; :324-340 — Continue button is the only dismiss control, no close glyph)Ring/Views/MainWindow.xaml.cs(PlcAlarmOverlay_PreviewKeyDown— Esc = Continue Monitoring, :1874-1883;PlcAlarmOverlay_PreviewMouseDown— click-outside inert, :1857-1872)Ring/Services/Alarms/PlcAlarmUiTimingStore.cs(ManualDismissCooldown= 120s, :27)Ring/Views/UserControls/StatusStripBar.xaml(alarm count pill)Ring/Views/Setup/AlarmPlaybookEditorScreen.xamlRing/Views/Setup/AlarmEscalationSettingsDialog.xamlRing/Views/Setup/EmailAlertsScreen.xaml(:26 Recipients, :158 Subscriptions, :180-183AlarmRulesTabCollapsed/IsHitTestVisible="False"with deployment-safe-hold comment)Ring/Views/Help/AlarmLegendScreen.xamlRing/Services/Alarms/AlarmNotifier.cs,IAlarmEscalator.cs,NoopAlarmEscalator.cs,SmtpAlarmEscalator.cs,WebhookAlarmEscalator.cs,PlaybookService.csRing/Infrastructure/Configuration/AppSettings.cs(AlarmEscalation.Modedefault "None")Ring/ViewModels/TankAttentionViewModel.cs(checked for XAML bindings — none found)Ring/Views/MainWindow.xaml.cs(OnPlcReconnectedtoast)OPERATOR_TRAINING_RUNBOOK.md§10