3a. Main Screen reference#
NavBar → Main Screen opens a popup with the plant's eleven fixed equipment screens. One of them, the read-only TVC overview, is what stands in for the hidden TVC Control rail button (see below). Every screen here is opened as a full-page view with its own Close button; none of them block you from using the rest of the app while open.
Quick index — live vs. reference-only, at a glance:
| Screen | Live data? |
|---|---|
| Make Ready Tank | Yes |
| Storage Tank Group (+ Storage Tank Detail) | Yes |
| Use Tank Group | Yes |
| TVC | Yes, read-only |
| Live Process | Yes, read-only |
| Caustic and Borax | Partially — weight is live, heat-tracing temperature and the component list are not instrumented |
| Receiving Hopper | No — names only, no live signal |
| Receiving Verification | Manual entry, database-only |
| Silo | No — names only, no live signal |
| Bulk Caustic Tank | No — names only, no live signal |
| Viscometer | Manual entry + calculation |
Note: Three screens (Receiving Hopper, Silo, Bulk Caustic Tank) show their equipment by name only, with no status light of any kind. This is deliberate: none of that equipment has a commissioned PLC tag behind it, and a column of identical "unavailable" badges would read as a fault rather than as "not watched." Each screen says so directly in its own caption. Do not read the absence of a status light on these three screens as a problem.
Make Ready Tank#
Purpose: the dedicated, full-detail view of the mix tank — level of detail beyond what the Dashboard's Make Ready Tank card can show.
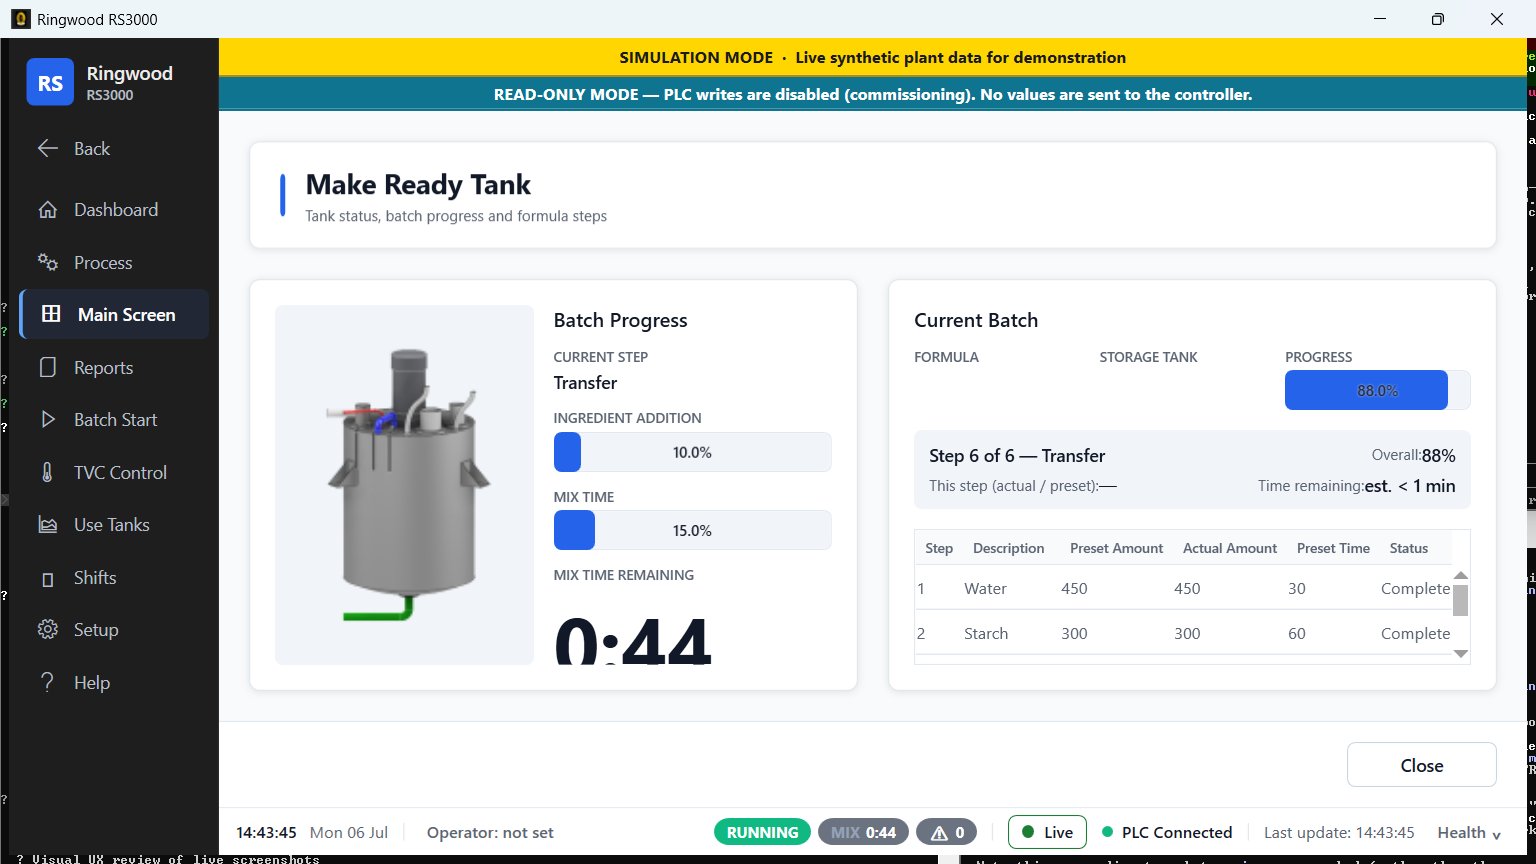
Layout: two cards side by side.
- Left card — the live vessel picture, large, with two overlays: a step callout chip (top-left, the current step's name) and an agitator status chip (top-right, green/red motor icon + on/off word). Both collapse when there is nothing to show (idle, or the agitator is untracked).
- Right card, top half — Batch Progress:
- A stale-data warning line (shown only when the batch snapshot has stopped advancing).
- Current Step (name).
- Ingredient Addition and Mix Time progress bars.
- Mix Time Remaining — the single largest, most-watched number on this screen.
- Tank Weight — the primary process value on this screen, sized to never clip even for a wide metric value.
- Temperature and Borax/Caustic weight, side by side with a hairline divider between them so they cannot be misread as one number.
- Right card, bottom half — Current Batch:
- Formula name and Storage Tank destination.
- A progress strip: "Step 3 of 9 — Domestic Starch", an Overall % complete figure, the current step's actual-vs-preset amount, and an ETA ("est. 12 min") for the whole batch — or, during the batch's finishing phase (the tail steps after the last dosed ingredient), the label swaps to "IN STEP" with the elapsed time in that step instead, because a fixed "time remaining" label would be misleading once nothing is actually being dosed.
- The full Formula Steps table (Step / Description / Preset / Actual / Preset Time / Status / Duration) — the same step-tracker language used on the Dashboard, with the current row highlighted gold.
- An empty-state message ("No batch loaded") replaces the table when nothing has run yet.
Note: This screen carries no Emergency Stop and no Pause/Resume button. Earlier drafts of the app had both, but neither was ever backed by a real command — Emergency Stop had no handler at all, and Pause/Resume only relabelled itself without touching the controller, which would have given a false sense of control. Both were deliberately removed. Use Process → Hold for a real, PLC-backed pause (see 02-running-batches.md §2.4).
Storage Tank Group#
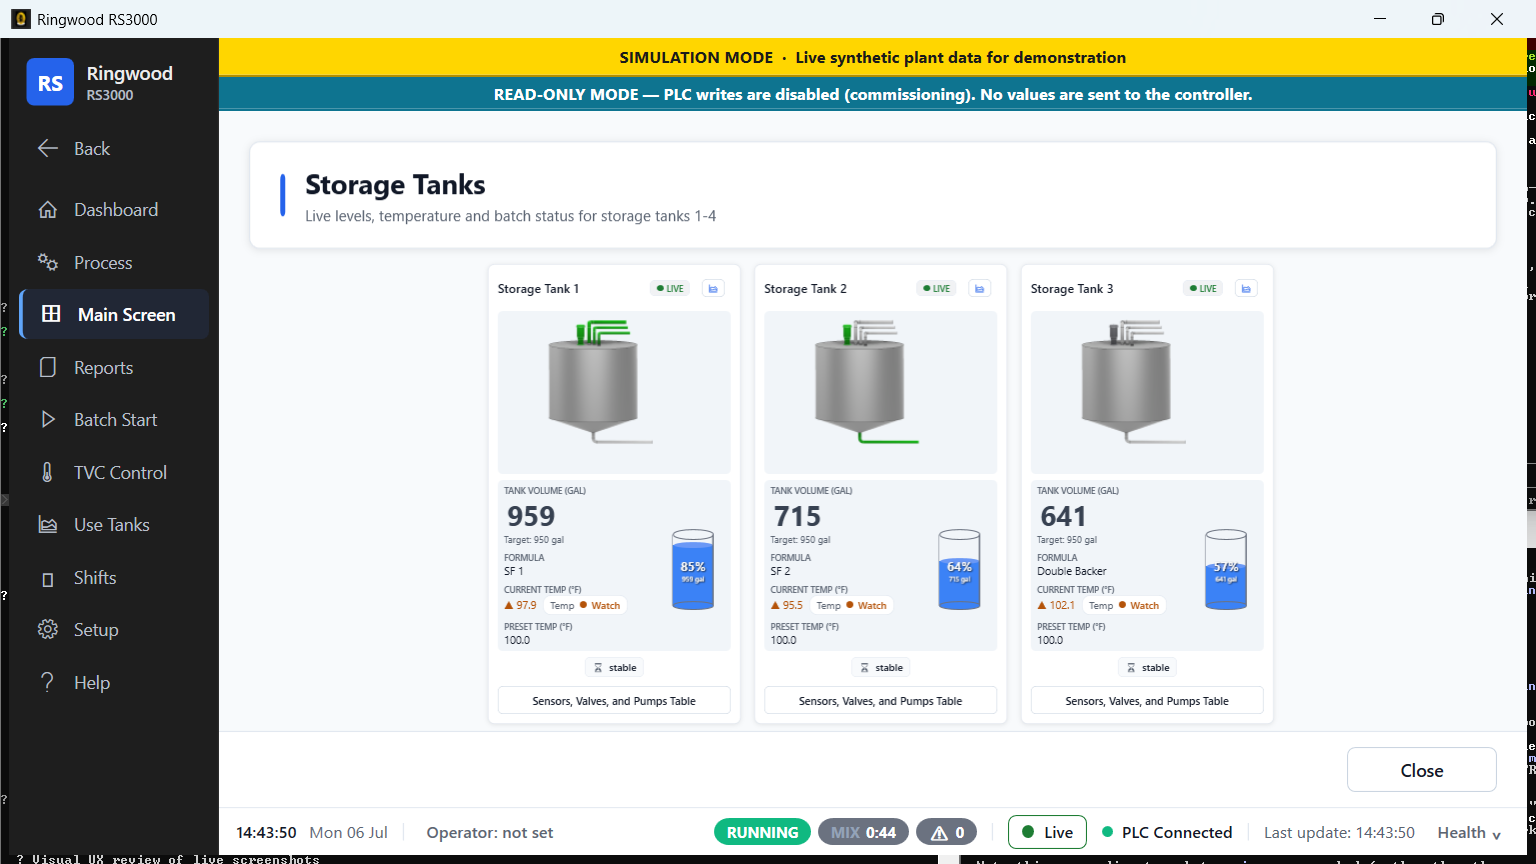
Purpose: all storage tanks at a glance, one card per tank, arranged in a single row (4 tanks) or two rows (5–6 tanks, roster-dependent). A group-wide data freshness chip (green LIVE / amber STALE / grey NO DATA) sits in the header — pinned there rather than inside the scrollable card area, so it never disappears from view.
Each tank's card, top to bottom:
- Header — the tank's name, a time-to-low trend readout (a prediction, not a live PLC value — computed from observed level descent), and a small trend-chart button.
- Vessel picture — a state render (idle/agitating/filling/etc.), fading between states.
- Data well:
- Volume (the glance value, large) with a color-coded state glyph (based on level), plus the batch target level underneath it.
- Current Temperature and Preset Temperature, each with its own state glyph.
- Formula — the recipe currently associated with this tank.
- A level gauge on the right, spanning the whole data well.
- Sensors, valves and pumps — an inline row of chips (not a button that opens a popup) for the tank's agitator and other equipment. The agitator chip carries live PLC status; the others show "no signal" honestly where no tag is commissioned, rather than a fabricated state.
Note: A tank's colored state ring (green idle / yellow batching / red fault, also described inside the app at Help → Operator Runbook §6.1) is the level-state glyph on the Volume readout — there is no separate "click to drill in" detail window from this screen for tanks 1–4. For tank slots 5 and 6 (where enabled), Batch Start routes to a dedicated detail screen instead — see below.
Storage Tank Detail (slots 5 and 6)#
Purpose: a plain, read-only detail card for a storage tank slot that has no dedicated legacy Batch Start screen (slots 5 and 6, when your plant's roster enables them). Reached from NavBar → Batch Start, not from Storage Tank Group.
What you see: a loud, persistent read-only banner reading "Detail-only slot — read-only. Batch start and TVC control are not available for this tank." (this screen has no write controls and no batch-start button at all — it is a viewer, not a starter), then a single card with five tiles: LEVEL, FILL, TEMP, FORMULA, and NOMINAL SIZE (those are the on-screen labels verbatim).
Use Tank Group#
Purpose: live temperatures and component status for the use (doser) tanks the line actually draws from — the screen's own subtitle is "Live Temperatures And Component Statuses."
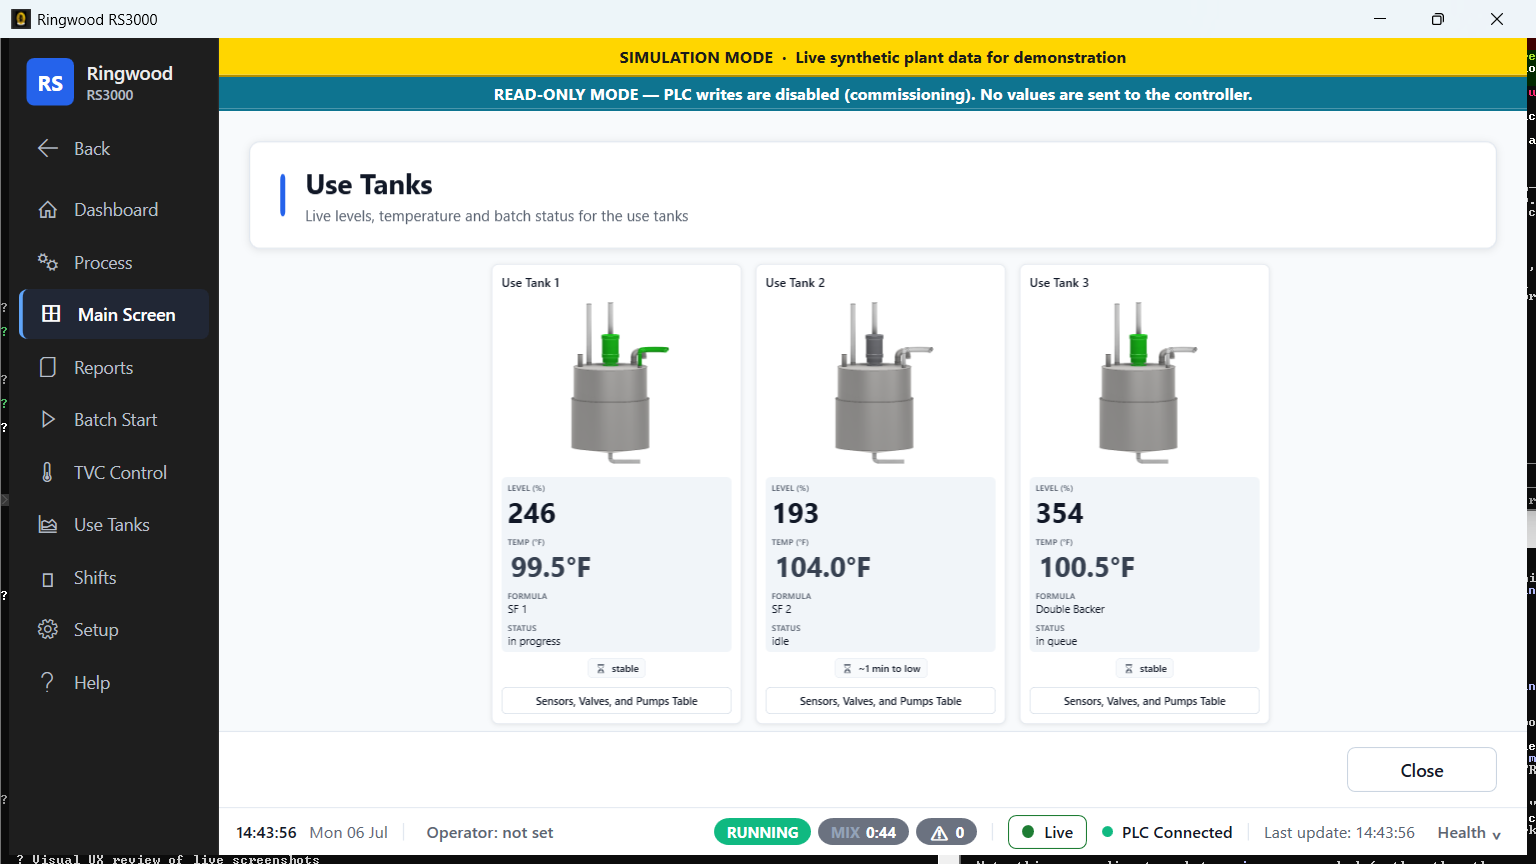
Layout: up to four cards in a row (more, in a second row, on a roster with more than four dosers). Each card:
Vessel picture — a state bitmap only. Use tanks have no continuous level instrument on this plant, so unlike storage tanks there is no proportional fill bar and no numeric level readout anywhere on this screen.
Note: This applies to this screen specifically, not to use tanks everywhere in the app. The Dashboard's use-tank tiles and Use Tanks → MF 1's Live Tank Data card do still show a Level / fill-percent number, read from the controller anyway — treat those as indicative only, never as a measured level. Temperature and the device chips are the trustworthy values on a use tank. See 3b §Use Tanks.
A heat badge, overlaid on the picture, appearing only while that tank is actively heating — the picture's own heater cue is a tiny nozzle graphic that is not legible at this size, so the badge exists specifically to make that state visible.
Temperature (glance value, with a state glyph) and Formula, side by side.
Sensors, valves and pumps, inline — agitator, inlet valve, adhesive supply valve, and adhesive supply pump all carry live PLC state; this is the one device table on this screen you can actually read at a glance without opening anything.
TVC#
Purpose: the read-only Temperature/Viscosity Control overview across the whole TVC system — the screen you should use day to day in place of the hidden TVC Control write screens.
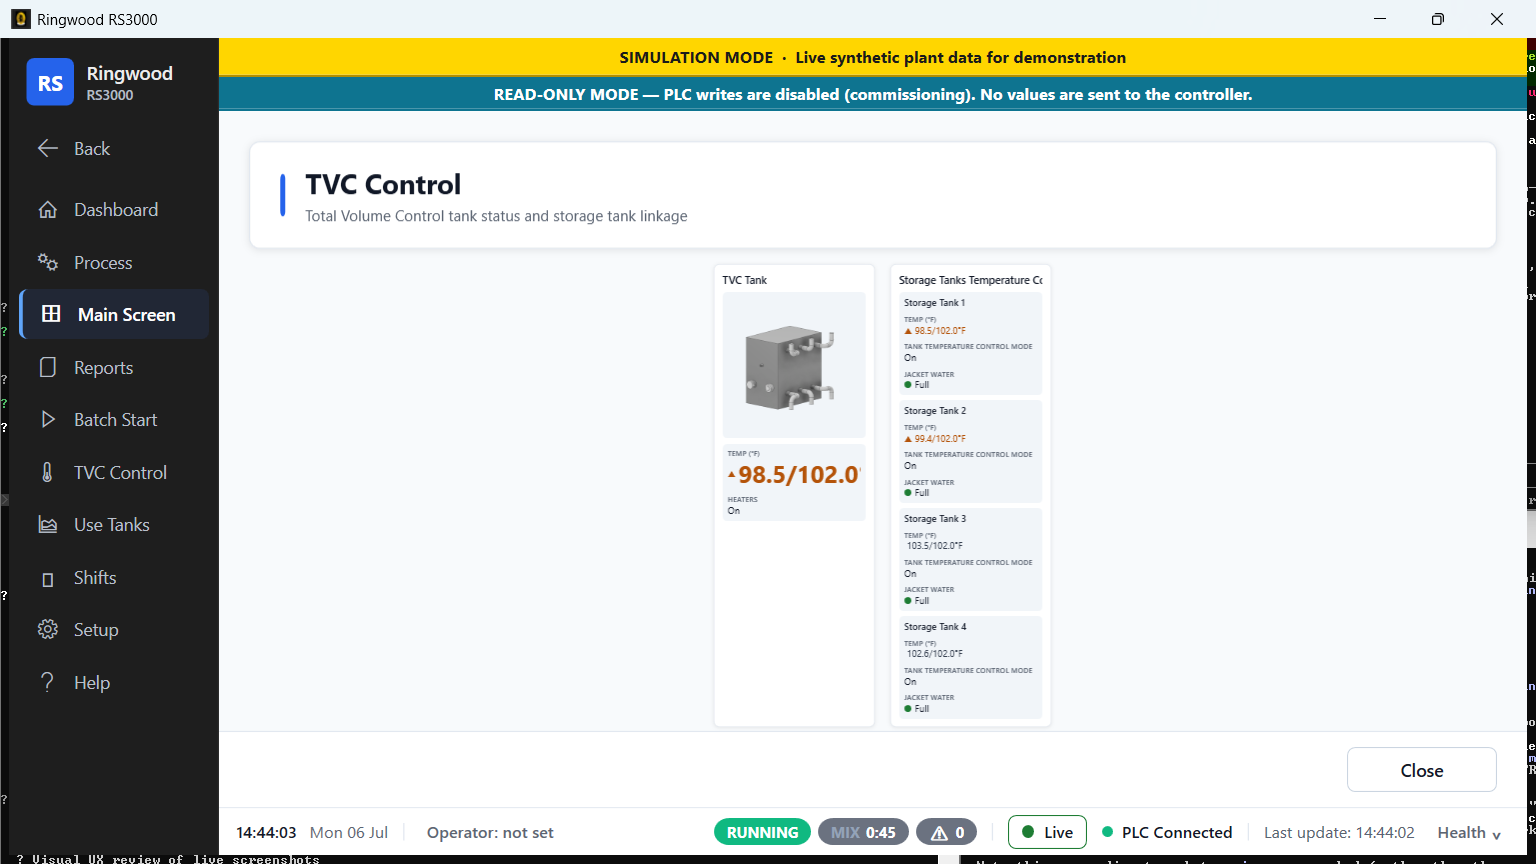
Layout: two cards.
- Left — TVC Tank: the main TVC vessel picture, its Temperature (with state glyph), and its Heaters status.
- Right — Storage Tanks Temperature Control: one tile per storage tank roster slot, two-up, each showing: Temperature (with state glyph), Temperature Control Mode, and a TVC pump indicator (colored dot + word — never color alone).
A tank slot with no live data shows an honest em-dash rather than a confident zero.
Live Process#
Purpose: the whole plant drawn as one product-flow train, left to right — Supply → Mixing → Distribution — entirely read-only: there is no command, no button, and no PLC write anywhere on this screen.
What you see, left to right:
- Supply column: Silo, Receiving Hopper, Borax + Caustic, and Bulk Caustic Tank, each with a small vessel picture and a connector line to the mixer. A connector only lights up while a fresh controller reading confirms product is actually moving through it — stale, unread, or all-zero-but-fresh data all render as the dim idle segment. The connector out of Bulk Caustic Tank is drawn permanently dim: no tag on this controller reports that replenishment transfer, so the screen says so in the tooltip rather than pretending it is live.
- Mixing (hero) column: the same Make Ready Tank vessel picture, larger, with the current step callout, the agitator badge, the Ingredient Addition/Mix Time bars, and Weight/Temperature mini-stats — a compact version of the dedicated Make Ready Tank screen. A brief water/steam/ additive inlet indicator appears above it only while that utility is actually charging.
- Distribution column: a row of storage-tank tiles (with a RECEIVING chip on whichever one is the live batch destination), the TVC skid, and a row of use-tank tiles with a connector down to "→ Corrugator" underneath.
A batch strip at the very bottom (outside the scaled area, so its text is never shrunk) repeats the RUNNING/IDLE pill, the current step position, and Mix Time Remaining, plus a STALE badge when the underlying data has gone quiet — the same wording used on the Make Ready Tank screen.
Note: Every connector on this screen — including the TVC heat leg and the tank discharge legs — goes dark the instant its own feeding poller stops delivering fresh data, even if the last known state was "flowing." A connector is never left showing a frozen "on" state.
Caustic and Borax#
Purpose: a mixed screen — one live number, one explicit "not instrumented" placeholder, and a reference-only equipment list. Read all three parts before trusting anything on it at a glance.
- Left card — an equipment diagram (static picture, for orientation only).
- Right card:
- Weight — this is live, reading the caustic/borax weigh tank/hopper.
- Heat tracing temperature — reads a plain "Not instrumented" label. No PLC tag exists for this reading; the screen states that fact outright rather than showing a permanently blank field that looks broken.
- Sensors, valves and pumps — twelve devices listed by name only, with the same "not commissioned, no status shown" caption used on Receiving Hopper / Silo / Bulk Caustic Tank below.
Reference-only equipment screens (Receiving Hopper, Silo, Bulk Caustic Tank)#
Three screens share one convention: they show their equipment by name only, with no status light of any kind, because none of that equipment has a commissioned PLC tag behind it. A column of identical "unavailable" badges would read as a fault rather than as "not watched," so each screen instead states the fact directly in its own caption. Do not read the absence of a status light on any of these three as a problem — it is deliberate, not a gap.
| Screen | Devices listed (name only) | Extra field |
|---|---|---|
| Receiving Hopper | High-level probe, fluidizer, diverter valve, domestic starch auger, two starch valves (6) | — |
| Silo | Conveying blower, rotary airlock, air pad blower, three level probes/transmitters (6) | "Silo Domestic Starch Level" reads "Not instrumented" |
| Bulk Caustic Tank | Overfill probe, leak detector, high/low level switches, and others (8) | — |
Receiving Hopper#
Purpose: a reference card for the receiving hopper's equipment, plus a direct hand-off into Receiving Verification for logging a delivery.
- Left card — an equipment diagram.
- Right card — the six devices in the table above, name only.
- Footer — a Record a bulk delivery button that opens Receiving Verification directly, plus Close.
Receiving Verification#
Purpose: the manual-first bulk-delivery reconciliation workflow — record what the bill of lading said against what was actually blown in, and see the variance immediately. This screen performs zero PLC reads and zero PLC writes — it is pure manual entry, saved to the local database.
Entry form fields: Expected (BOL) weight, Blown-in (actual) weight, Supplier, BOL number, Received date, Received time, Entered by, and Notes.
Live variance preview, updated as you type: Variance, Variance %, Tolerance, and a plain-language Verdict. If no tolerance percentage has been configured for this plant (Setup → Analytics), the caption says so directly — the verdict is never shown as "within tolerance" by default when no one has actually set a tolerance.
Recent events grid below the form: When, Supplier, BOL Number, Expected, Blown-in, Variance, Variance %, Tolerance, Verdict, Entered by, and Notes — with Refresh and Export CSV buttons.
Note: Weights on this screen follow your display-unit preference for entry and display, but are stored as native pounds — the same "pounds are the truth" rule that applies to formulas; see 05-formulas-and-recipes.md §Units.
Silo#
Purpose: a reference card for the silo's equipment — same two-card shape as Receiving Hopper, plus the one extra field in the table above.
- Left card — an equipment diagram.
- Right card — the "Silo Domestic Starch Level" placeholder, followed by the six devices in the table above, name only.
Bulk Caustic Tank#
Purpose: a reference card for the bulk caustic tank's equipment — the same shape again, with the eight devices in the table above, name only.
Viscometer#
Purpose: the manual viscosity workflow — the plant measures viscosity by hand (or with an offline device) and types the result in here.
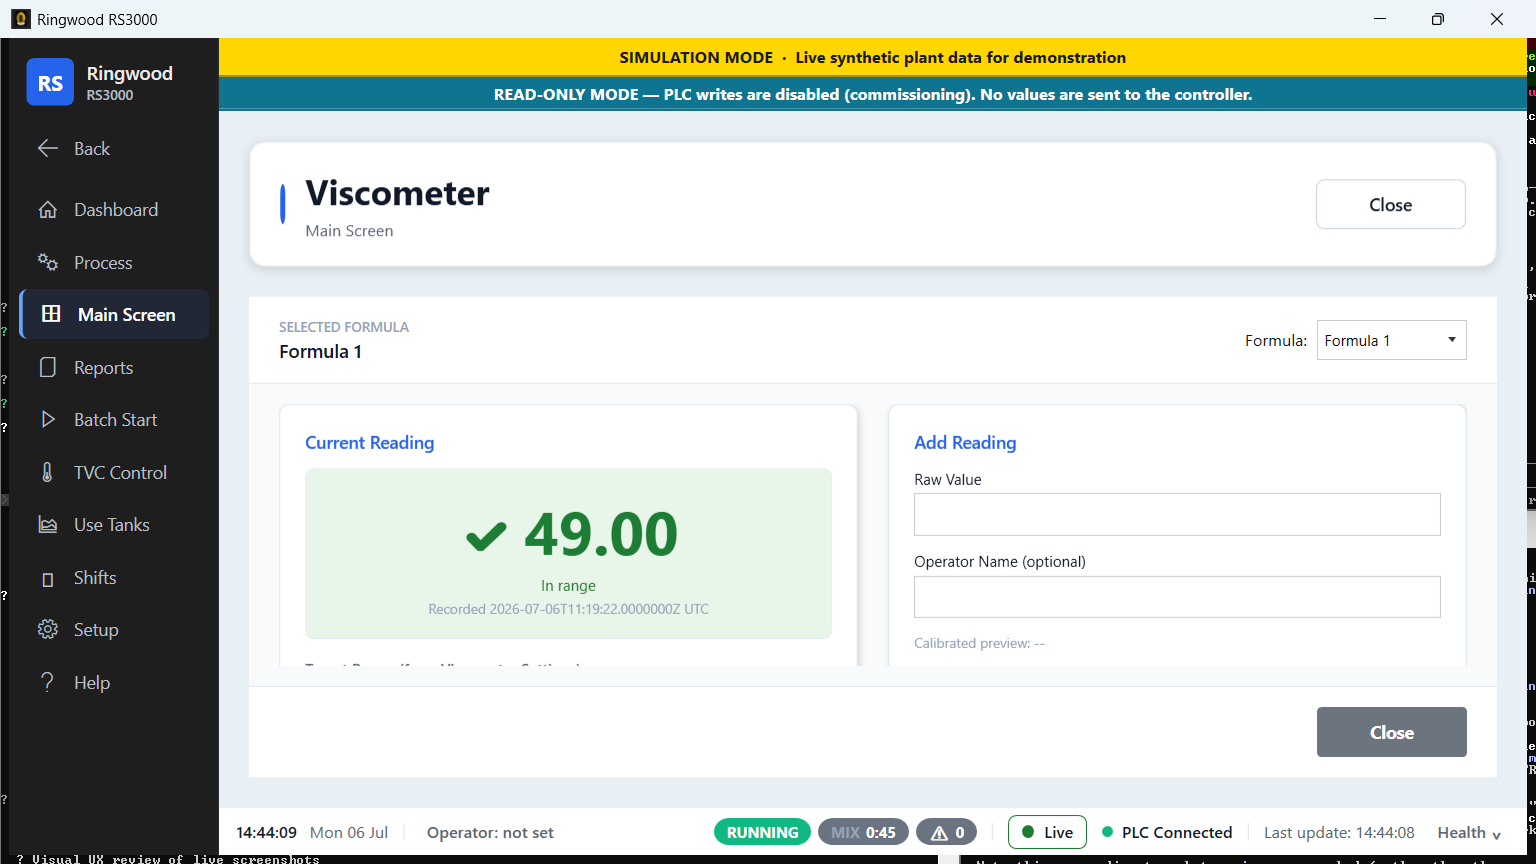
- Header: a Formula picker.
- Left card — Current Reading: the most recent reading for the selected formula, a state glyph (warning/alarm/ok — never color alone), the timestamp, and the configured Alarm Low / Alarm High target band. A calibration summary line at the bottom reads "Calibration: none (showing raw value)" when no calibration coefficients are set for this formula.
- Right card — Add Reading: a Raw Value field, an optional Operator Name field, a live Calibrated preview as you type, and a Record Reading button.
- Bottom — Recent Readings: a small SPC (statistical process control) trend chart of recent calibrated readings against the alarm band, and a history grid (Recorded (UTC), Raw, Calibrated, Operator) for up to the last several readings.
Calibration coefficients themselves are edited under Setup → Formula Edit → Viscometer Settings (supervisor-gated) — a walkthrough also exists inside the app at Help → Operator Runbook §9.5.
TVC Control (hidden)#
One more NavBar rail button, TVC Control — it sits between Batch Start
and Use Tanks — exists in the software but ships hidden (Collapsed/
disabled) — its per-tank screens contain a real write path to the
controller and are held back pending a commissioning decision. The
read-only TVC overview above covers the same tanks without that write
surface, and is what you should use day to day.
Sources verified#
Ring/Views/MainScreen/MakeReadyTank.xamlRing/Views/MainScreen/StorageTankGroup.xamlRing/Views/MainScreen/StorageTankDetailWindow.xaml(:57-105, five tiles)Ring/Resources/Strings/Strings.en.xaml(S.Scr.StorageTankDetail.*— banner text and the five tile labels verbatim, :1183-1189)Ring/Views/MainScreen/UseTankGroup.xaml(:172, "use tanks have no continuous level" comment)Ring/Views/MainScreen/TVC.xamlRing/Views/MainScreen/ProcessOverview.xamlRing/Views/MainScreen/CausticAndBorax.xamlRing/Views/MainScreen/ReceivingHopper.xaml,ReceivingHopper.xaml.csRing/Views/MainScreen/ReceivingVerificationScreen.xaml,ReceivingVerificationScreen.xaml.csRing/Views/MainScreen/Silo.xaml,Silo.xaml.csRing/Views/MainScreen/BulkCausticTank.xaml,BulkCausticTank.xaml.csRing/Views/MainScreen/Viscometer.xamlRing/Views/UserControls/NavBar.xaml(:153-216 rail order — TvcControl is the sixth button, between Batch Start and Use Tanks; :297-390 the eleven-item Main Screen popup)- OPERATOR_TRAINING_RUNBOOK.md §6.1, §9.5 (referenced, not link-quoted)