3. Screens reference — Dashboard#
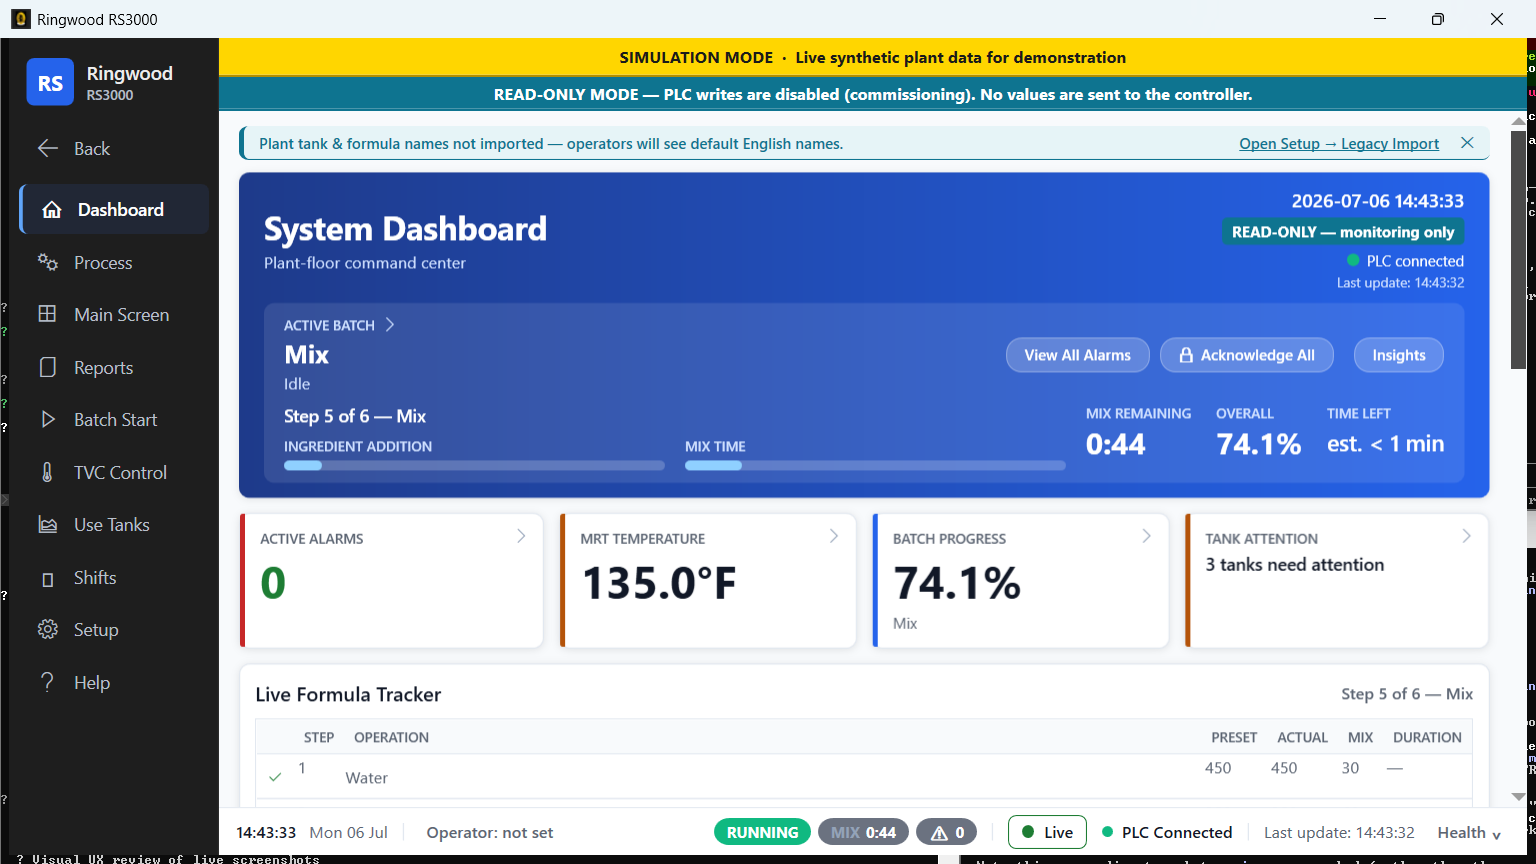
This chapter is split across three files because there is a lot of ground to cover in real detail, screen by screen:
- 3. Screens reference — Dashboard (this file) — the landing screen, card by card.
- 3a. Main Screen reference — the eleven equipment screens under the Main Screen NavBar button.
- 3b. Use Tanks, Shifts, Setup and Help reference — everything else: Use Tanks, Process, Shifts, the Reports hub (indexed; full depth is 06-reports-and-history.md), Setup, the Setup Wizard, and Help.
For the exact menu contents (which button opens which popup, and which items are currently hidden at this plant), a menu map also exists inside the app at Help → Operator Runbook §2.1 (source: OPERATOR_TRAINING_RUNBOOK.md in the Ring repository), though it is regenerated less often than this manual. These three files instead answer, region by region: what is it for, what is actually on screen, what does each control do, what does healthy vs. unhealthy look like, and what mistakes to watch for.
Dashboard#
Your default landing screen, opened at startup and by clicking Dashboard on the NavBar. It is deliberately compact — the screens you use all day (Batch Start, Storage Tanks, Alarms) are one click away on the NavBar, so the Dashboard's job is a single-glance summary, not a place you work from. It is laid out top to bottom as four bands: the alarm band, the operations band (formula tracker + tank rail), the KPI strip, and — on a freshly installed station only — a names-import nudge banner above everything else.
Names-import nudge (first-run only)#
If this station has never imported tank names from the legacy system, a banner appears above the alarm band pointing you at Setup → Legacy Import. It carries a dismiss (✕) for the session — dismissing it does not import anything, it just quiets the reminder until next restart. You will not see this banner at all once names have been imported once.
The alarm band#
A card that is always present, whether or not anything is wrong. It states plant health in one line, colors itself accordingly, and — only when there is something to show — drops a short list of alarms underneath.
| Headline | Bar color | When it shows |
|---|---|---|
| "ACTIVE ALARMS · Attention required" | Red | One or more alarms are in the live (unresolved) band. |
| "ACTIVE ALARMS · All systems normal" | Green | The alarm list is genuinely empty and the PLC link is healthy. |
| "ACTIVE ALARMS · Alarm data unavailable" | Amber | The alarm list is empty, but only because the PLC link is down — this is deliberately never shown as the green all-clear. |
A count pill sits beside the headline (grey "0" when clear, red otherwise), and — only while at least one alarm is active — a small "oldest active: 12m" readout shows how long the longest-standing fault has gone unaddressed. Two buttons live on the same bar:
- View All Alarms — jumps straight to the full Alarms screen (Process → Alarms).
- Silence — silences the currently active alarm(s) from the Dashboard itself, without navigating away. Disabled/gated exactly the same way as the Silence button on the Alarms screen — see 04-alarms-and-attention.md.
When the list drops down, each row shows: a severity dot + word (Critical/Warning/Info), a lifecycle chip (glyph + word — Active/Silenced/ Resolved, the same shape-plus-color convention used everywhere alarms appear), the alarm number and description, a one-tap "Go to <screen>" link when the alarm maps to a specific tank or system screen, and the time it was raised with a live "how long ago" readout. A resolved (cleared) row is visually dimmed so a page of cleared history reads calm, never like a wall of red. Clicking a row (not the "Go to" link) also opens the Alarms screen.
Note: The row's "Go to" link only appears when the alarm maps cleanly to one screen (a specific tank, the Make Ready Tank, or the TVC). A plant-wide fault has no such link — that is expected, not a bug.
The formula/operations panel#
This panel shows exactly one of two bodies, gated purely on whether a
batch is currently running (MakeReadyTankViewModel.CurrentStepIndex), so
"both" and "neither" can never both be on screen:
While a batch is running — the live step tracker. A table with one row per formula step: Step, Operation, Preset amount, Actual amount, Mix (preset time), and Duration. Each row carries a status glyph and color:
| Row state | Glyph | Look |
|---|---|---|
| Complete | check mark | Muted grey text |
| In Progress | right arrow | Highlighted gold background, bold text |
| Pending (upcoming) | (none) | Dimmed |
| Stalled | (none — the In Progress row itself) | Amber background — see below |
A step is flagged stalled when it has run longer than the greater of about 2 minutes or 3× its own preset mix time — this is a warning that something downstream may be stuck, not an error. Beside the formula name, an ON HOLD chip appears whenever a hold-related alarm is active, with the reason text next to it. A destination arrow ("SF 1 → Storage Tank 2") shows which tank this batch is filling, when the controller reports one.
While idle — the last batch's recipe, for reference only. The header changes to "Formula Steps — Last Batch" and the table drops the Actual and Duration columns entirely — this view is explicitly not live, it is a read from the local database of the most recently completed batch, so you can see what it looked like without implying the controller is doing anything right now. A Start Batch button appears in this state only, taking you straight to that same tank's Batch Start screen.
Warning: Do not read the idle-state recipe table as a live batch. It has no Actual or Duration columns specifically so it cannot be mistaken for one — if you see those two columns, a batch really is running.
After a batch finishes, a one-line green completion banner ("Batch #123 complete — ...") stays visible until you dismiss it or the next batch starts, so a two-hour batch's result is not lost in the next screen refresh.
The Make Ready Tank card (right column, top)#
A live snapshot of the mix tank, click-through to the full Main Screen → Make Ready Tank screen (see 03a-main-screen-reference.md). Reading it top to bottom:
- Weight and Temperature — the two largest numbers on the card.
- Borax/Caustic weight and the Agitator on/off state, on one quiet line.
- A live vessel picture beside the numbers, showing the tank's current operation (steam, discharge, agitating, etc.) — it fades between states rather than snapping, and it glows only while a batch is genuinely running. The glow — and the picture's freshness — turns off in three cases: the tank is idle, a hold-family alarm is active (a held batch is not "running"), or the batch data has gone stale. A frozen picture is deliberately dimmed so it never looks live when it is not.
- When idle, a plain "No batch running" line replaces the running-state detail below.
- A stale-data caption, shown only when the batch snapshot has stopped advancing — the same "batch data is stale" condition the dedicated Make Ready Tank screen flags.
- Last logged viscosity — a quiet line reading the most recent hand-typed viscometer reading for this tank from the database. It reads "Viscosity —" if nothing has ever been logged. This is never a live PLC reading — see 03a-main-screen-reference.md §Viscometer.
- Early-warning chips, shown only when a specific analytics threshold has been configured and tripped against a reference "golden batch" baseline — off by default, and entirely display-only.
- Ingredient Addition and Mix Time progress bars, and a Mix Remaining hero number — visible only while running, and dimmed together with the picture when the batch sample goes stale.
The Storage/Use tank rail (right column, below Make Ready Tank)#
One card, click-through to Storage Tank Group, containing:
- A freshness chip in the header — a green dot + "LIVE", amber "STALE", or grey "NO DATA" label. This is the one PLC-freshness indicator for this whole rail; the tank art and gauges below dim together with it when data goes stale.
- One row per storage tank actually installed (a disabled tank's row simply is not there — the rail does not reserve blank space for it). Each row carries, left to right: a small live vessel picture, a level gauge, the tank's name with an agitator glyph (when running) and a RECEIVING chip (while this tank is the batch destination), a fill-percent + temperature readout on the right, and — underneath the name — the tank's last completed batch as one quiet line, with a delivered-vs-requested variance chip when there is a record. Clicking that line opens that batch's report. A tank with no PLC configuration at all (nominal size and target level both zero) shows a plain "not in service — no PLC" line instead of fabricated readouts.
- A Use Tanks strip underneath — four small tiles, always visible (no tab to click), each with a vessel picture, a level gauge, the tank name, and fill-percent + active formula. Use tanks have no continuous level instrument on this plant, so treat this fill-percent as indicative only, not a measured level — see 3a §Use Tank Group.
- A TVC rail row at the very foot — one line with the TVC vessel picture, the word "TVC", a Heaters state (accent-colored only while actually calling for heat), and the temperature on the right. Clicking it opens Main Screen → TVC.
The KPI strip#
A single footnote-style row under the operations band — four label+number pairs, hairline-separated, plus an Insights button:
| Cell | What it shows | Click goes to |
|---|---|---|
| Batches this shift | Count of batches started this shift | Reports → Insights (Glue Used card) |
| Dry starch this shift | Derived, not measured, dry-starch pounds used this shift | Reports → Insights |
| Soonest tank low | The one tank observed actually descending and projected to run low soonest — a flat, rising, or unreadable trend renders "No tank draining," never a falsely reassuring number | Main Screen → Storage Tank Group |
| Batches queued | How many batches are queued on the planning board, plus what's next | Reports → Batch Queue Board |
Each cell's tooltip carries the fuller explanation (e.g. the dry-starch derivation disclosure) so a sentence never has to be crammed into the quarter-width cell itself. Insights opens the full analytics page — see 06-reports-and-history.md §Spend, yield and usage.
Sources verified#
Ring/Views/Dashboard/DashboardView.xaml(read in full)Ring/Views/UserControls/NavBar.xamlRing/Views/MainScreen/UseTankGroup.xaml(:172, use-tank level-instrument note)- OPERATOR_TRAINING_RUNBOOK.md §2.1 (referenced, not link-quoted)