03 — PLC Communications: the read path#
Who this is for. Anyone adding a read, debugging a stale or dark value, diagnosing a session-starvation burst, or trying to work out why a screen shows "no data" instead of a number.
What you'll learn. How Ring actually talks to a CompactLogix through libplctag; every poller and its cadence; the timers that live outside the polling coordinator and will otherwise cost you an afternoon; how snapshots, caches and freshness gating work; the index maps; the heartbeat state machine and the two different questions it answers; the diagnostic services around the link; and how demo mode substitutes for all of it.
The write path is chapter 04. Controller facts
that older documents get wrong are in
docs/PLC_FACTS.md — read it once before you form any
belief about the ladder.
3.1 Transport: libplctag, and what Ring does not do#
Ring uses libplctag 1.5.2 with libplctag.NativeImport. There is no custom
EtherNet/IP implementation and no CIP code in this repository.
The shape of every read is the same
(Ring/Services/PLC/PlcTagReader.cs:276-300 is representative):
using (var tag = new Tag<IntPlcMapper, short>
{
    Name      = _tagName,
    Gateway   = _ip,               // PlcConnectionConfig.GetPlcIp()
    Path      = _path,             // PlcConnectionConfig.GetPlcPath(), default "1,0"
    PlcType   = PlcType.ControlLogix,
    Protocol  = Protocol.ab_eip,
    Timeout   = TimeSpan.FromMilliseconds(_readTimeout)
})
{ ... }
Three consequences follow directly:
- A fresh
Tagper read, then dispose. There is no C#-level session pool. Session reuse is entirely libplctag's business, which is why session-count pressure shows up as a transport symptom (ErrorTimeoutbursts) and not as anything you can see in Ring's own code. - The controller has very few sessions. A CompactLogix caps at roughly four
to eight EtherNet/IP sessions per source IP
(
docs/PLC_FACTS.md). This is the reason the polling coordinator staggers poller startup and the reason every field script warns before opening a session against the live box. Pathis the CPU slot route."1,0"= port 1, slot 0. It is resolved byPlcConnectionConfig.GetPlcPath()reading the config file on every call — see chapter 02 §2.3.
PlcTagReader — the per-tag reader#
Ring/Services/PLC/PlcTagReader.cs implements IPlcTagReader. Its read timeout
comes from PlcSettings.ReadTimeout, defaulting to 3000 if config is
unavailable (PlcTagReader.cs:39) — but the shipped Ring/Config/appsettings.json
sets ReadTimeout to 2500, so the effective value on a normal install is
lower than the compiled default; read the file, not this sentence, for the
number that is actually in force. Two of its behaviours are non-obvious:
BOOL array elements are read as DINTs and bit-extracted. For a tag like
Alarm_Triggers[1], TagBool does not work for individual array elements. The
reader computes dintIndex = arrayIndex / 32, bitPosition = arrayIndex % 32,
reads Alarm_Triggers[dintIndex] as a TagDint, and masks the bit
(PlcTagReader.cs:205-249). Non-array BOOL tags take the direct TagBool path.
INT is 16 bits and must be read as such. Both scalar tags (current_step)
and UDT members must use Tag<IntPlcMapper, short>; a TagDint (32-bit) read
against a 16-bit INT returns ErrorOutOfBounds (PlcTagReader.cs:279-284).
UDT members are read by byte offset. libplctag cannot address a UDT member,
so PlcTagReader.ReadUdtMember() (PlcTagReader.cs:86-152) parses
Tanks[n].Member, hands off to UdtTankReader, and extracts the field from the
whole-UDT byte buffer using the offsets in
Ring/Services/PLC/UdtTankLayout.cs:
| Member | Byte offset | Source |
|---|---|---|
Request_level |
16 | UdtTankLayout.cs:38 |
Tank_Num ("Spare") |
18 | :39 |
Formula_number |
20 | :40 |
Batch_Size |
22 | :41 |
Start_Type |
24 | :42 |
Splitting_A |
26 | :43 |
Splitting_B |
28 | :44 |
| whole-UDT size | 184 bytes (provisional — see note) | UdtTankLayout.TankUdtSizeBytes, :68 |
The 184-byte size is provisional in a way the seven member offsets are not.
The class doc marks it explicitly: it is walked from the L5K DATATYPE Tank
block with standard ControlLogix alignment rules, but it "has not been
byte-confirmed against a live controller read; it is used only to size a
diagnostic read buffer, never to place a write" (UdtTankLayout.cs:46-67). The
seven offsets Ring actually reads and writes (16–28) sit in the leading
tightly-packed region and are exact regardless.
UdtTankLayout additionally maintains a VerifiedOffsets set and an
IsVerifiedOffset(byteOffset) predicate (:70-85) — a distinction between "we
walked this out of the L5K DATATYPE Tank block" and "we guessed", not between
"computed" and "round-tripped against a controller": IsVerifiedOffset's own
doc says it is true "only for byte offsets that correspond to a member
verified against the L5K Tank UDT" (:83-84) — a static export, not a
live controller read. The write path uses the predicate to refuse a guessed
offset; it does not claim the offset was proven on hardware. The extract/insert primitives
(ExtractInt16 / InsertInt16, :93-115) are pure math with explicit bounds
checks, so they are unit-testable without a PLC.
If a UDT layout changes on the controller, UdtTankLayout is what must
change here. Nothing detects the drift automatically.
A second UDT hazard: bit-packed SINT members are exposed by the controller under generated alias names of the form
ZZZZZZZZZZ<suffix>— e.g.Tanks_c[n].ZZZZZZZZZZTank_c35. Reading the "obvious" member name instead of the alias returnsErrorBadParamand ships a permanently dark indicator, which has happened here more than once (docs/PLC_FACTS.md; the alias sweep isdocs/reference/plc/UDT_ALIAS_SWEEP.md). Grep the L5KDATATYPEblock for the verbatim name before trusting any UDT member string.
3.2 The polling coordinator#
Ring/Services/PLC/PlcPollingCoordinator.cs is the single façade for background
polling. Start() (:132-200) does, in order:
Stop()— always, soStartis idempotent and never leaks a timer.PlcHeartbeatConnectionTracker.Reset().- Resolve
EnableBatchStartPollingfrom settings (defaulttrue). - Construct and start the pollers staggered.
- Fire the startup batch reconcile and controller-stamp catch-up on a
background
Task(:165-180).
The seven pollers#
| Poller | Cadence | Startup delay | Reads → publishes |
|---|---|---|---|
PlcSnapshotPoller |
500 ms (backs off to 5000 ms after 2 consecutive failed live cycles) | 0 | PC_Read_Float[0..34] as one REAL array → PcReadFloatSnapshot + MakeReadyTankPlcData; piggybacks PC_Display_Outputs[0..31] → PcDisplayOutputsCache on the same cycle |
PcReadIntegerPoller |
two timers: 1500 ms heartbeat, 5000 ms full block | 0 | heartbeat PC_Read_Integer[0] → PlcHeartbeatConnectionTracker; full [0..479] → PcReadIntegerCache |
BatchStepsPoller |
2000 ms | 150 ms | Batch_Current_Preset_* arrays + current_step → BatchStepsSnapshotHolder; drives BatchLifecycleRecorder |
StorageTankGroupPoller |
2000 ms | 300 ms | per roster storage slot, Tanks[PlcIndex] fields → StorageTanksSnapshotHolder |
UseTankGroupPoller |
2000 ms | 450 ms | per roster doser slot (pinned or discovery-filled) → UseTanksSnapshotHolder |
TVCPoller |
2000 ms | 600 ms | TVC[PlcIndex], TVC_Ctrl, TVC_IO → TVCSnapshotHolder |
BatchStartPoller |
2000 ms, only when PlcSettings.EnableBatchStartPolling |
750 ms | Tanks[PlcIndex] batch-start members → BatchStartSnapshotHolder |
(Cadences and delays verified in PlcPollingCoordinator.cs:141-199; backoff
constants in PlcSnapshotPoller.cs and PcReadIntegerPoller.cs.)
What each poller actually asks the controller for#
Cadence alone does not tell you the cost of a poller. These are the tag names, read out of the reader services:
PlcSnapshotPoller — one array read of PC_Read_Float (35 REALs, indices
0–34) plus PC_Display_Outputs on the same cycle
(PlcSnapshotPoller.cs:251, 334). Two reads per tick, not thirty-five: it is
the cheapest poller per value in the app. Its own read timeout is a local
ReadTimeoutMs = 2000, and after FailuresBeforeBackoff = 2 consecutive failed
live cycles it drops to BackoffIntervalMs = 5000.
PcReadIntegerPoller — two independent timers with independent backoff:
| Timer | Reads | Timeout constant |
|---|---|---|
| heartbeat, 1500 ms | PC_Read_Integer[0] only |
HeartbeatReadTimeoutMs = 1000 — "keep short so disconnect is felt quickly" |
| full block, 5000 ms | PC_Read_Integer[0..479] in one bulk read, with an indexed fallback |
BulkReadTimeoutMs = 3000, IndexedReadTimeoutMs = 1500 |
Backoff is separate per timer (HeartbeatBackoffIntervalMs = 5000,
FullDataBackoffIntervalMs = 8000, two failures each). The full block only runs
while AllowHeavyPlcPolling() is true; the heartbeat always runs, because it is
what decides that.
StorageTankGroupPoller → StorageTankTagReaderService, per mapped storage
slot: Tanks[n].Level (with a documented fallback to Tanks[n].LA_Weight when
Level fails, :75-81), Tanks[n].Formula_number (:174),
Tanks[n].Current_Temp (:197), Tanks[n].Request_level (:220),
Tanks[n].Preset_Temp (:396), Tanks_c[n].nominal_Size (:369).
One sensor-honesty detail worth copying: a
Levelreading belowSensorFaultEpsilonis treated as a level-transmitter fault, not 0 gal, and the tank's level is not advanced (StorageTankTagReaderService.cs:98). A zero that means "broken" must never render as a zero that means "empty".
UseTankGroupPoller → UseTankTagReaderService, per doser slot:
Tanks[n].Level / .LA_Weight / .Formula_number / .Current_Temp /
.Request_level / .Preset_Temp / .Status / .Fill_from_tk /
.Liq_*, plus the commissioning bytes Tanks_c[n].ZZZZZZZZZZTank_c17,
…Tank_c35, …Tank_c44, Tanks_c[n].LA1_pump and Tanks_c[n].nominal_Size
(line numbers as listed in UseTankTagReaderService.cs). It also runs the
role-byte discovery that fills doser slots whose roster PlcIndex is -1,
re-validating periodically and merging results — because a single pass cannot
distinguish a transient role-byte read timeout from "not a Use Tank", so caching
the first non-empty result forever would hide a real doser until restart.
TVCPoller → TVCTagReaderService, per storage slot, five reads issued
concurrently and awaited together (TVCTagReaderService.cs:55-61):
TVC[n].Current_Temp, TVC[n].Preset_Temp, TVC[n].Temp_mode,
TVC_Ctrl[n].ZZZZZZZZZZTVC_Contro0 and TVC_IO[n].ZZZZZZZZZZTVC_I_O0. The last
two are the alias reads — bit-packed SINTs exposed under generated names —
and the code then unpacks them by mask (bit 0 = enabled, and so on, :70-76).
This is the concrete instance of docs/PLC_FACTS.md §7: reading
TVC_Ctrl[n].enabled directly would return ErrorBadParam.
BatchStepsPoller → BatchTagReaderService.TryReadAllStepArrays, which
reads Batch_Current_Preset_Operation, Batch_Current_Preset_Amount,
Batch_Current_Actual_Amount and Batch_Current_Preset_Mix as whole arrays
(not per-step tags), plus current_step, plus Batch_Current_Stamps on demand.
MaxSteps = 30 — raised from 18 so a recipe longer than 18 steps is not
silently truncated — and array index [0] is skipped (FirstStepArrayIndex = 1).
The service caps indexed fallbacks per read (MaxIndexedFallbacksPerRead) so a
failing bulk read cannot degrade into a burst of dozens of single reads.
BatchStartPoller — per storage slot, Tanks[n].{member} through the
UdtTankReader byte-offset path (BatchStartPoller.cs:140), plus
Formula_Info[f].Volume (:421) and System_Configuration[i] (:432). It
caches the two batch-start commissioning bits per PLC index
(tank_installed, Storage_tank OR Storage_tank2) rather than re-reading them
every tick. It is read-only; its own class doc says so, and the batch-start
write path is a separate, untouched code path.
Why the stagger exists is stated at the call site: on controllers with a low
concurrent-session cap "a simultaneous boot spike causes a transient
session-exhaustion read-error burst that self-recovers; staggering smooths the
ramp" (PlcPollingCoordinator.cs:182-186). The heartbeat and float pollers stay
immediate because they are liveness and a single cheap read.
Why the full integer block stays at 5000 ms is also documented in place
(PlcPollingCoordinator.cs:144-148): PC_Read_Integer[0..479] is the largest
single read in the app and the live controller also serves the legacy HMI, so
its cadence is not doubled. The freshness race that would otherwise create is
handled on the consumer side —
MakeReadyTankViewModel.PcReadFreshnessWindow is 12 s, which covers the 5000 ms
cadence even one failed tick deep.
Every poller guards re-entrancy with an Interlocked busy flag (_isPolling,
0 = idle / 1 = polling), so a slow cycle skips the next tick rather than
stacking cycles.
Roster snapshotting: a real constraint#
StorageTankGroupPoller, UseTankGroupPoller, TVCPoller and
BatchStartPoller all take their slot list at construction and never
re-read it:
"The roster is snapshotted at construction; a roster change (Setup save) requires an app restart to take effect on the pollers — this keeps cache sizing and slot→column mapping correct with no fragile mid-run resize." —
Ring/Services/PLC/StorageTankGroupPoller.cs
Nothing in the app subscribes to TankRosterState.Changed. This is why the
write side needs its own mid-session-change lock (chapter 04): after a Setup
save, what the screen displays and what a write would target are resolved from
two different rosters.
Ring/Services/PLC/RosterPollPlan.cs is the pure, PLC-free translation of a
roster into per-slot read targets — the read-side twin of RosterWriteIndex.
Pause without blinding the operator#
PauseDatabaseWriters() / ResumeDatabaseWriters()
(PlcPollingCoordinator.cs:55-90) stop only BatchStepsPoller — the one poller
in this stack that writes SQLite — and leave the read-only pollers running, so a
database restore or factory reset does not black out the live screens. The pause
is a bounded deterministic drain: StopAndDrain(BatchStepsDrainTimeout)
waits up to 10 s for an in-flight poll (a whole-array read plus an insert) to
finish, and logs a warning if it does not.
3.3 The timers that live outside the coordinator#
This is the gotcha that costs people an afternoon: the coordinator is not the
only thing that talks to the controller. PlcPollingCoordinator.Stop() stops
seven pollers; it does not stop any of the following, and none of them appears
in the stagger plan.
ARCHITECTURE.md §3 names five such timers — the alarm pump,
TrendingDataService, InventoryEventCaptureService, TagInspector and
InventoryEditScreen. That list is correct as far as it goes; the table below
adds MainWindow's other two timers (the UI PLC tick and the auto-reprobe,
both of which do reach the controller) and keeps ViscometerLiveRecorder in
view precisely because it is the one people wrongly count.
| Owner | Cadence | Does it touch the PLC? |
|---|---|---|
MainWindow PLC alarm background pump |
2 s (MainWindow.xaml.cs:170) |
Yes — drives AlarmAlarmNumberPlcService, which bulk-reads Alarm_Alarm_Number[0..39] itself |
MainWindow _plcUpdateTimer (DispatcherTimer) |
2 s (MainWindow.xaml.cs:663) |
Indirectly — also pumps the same alarm method; a CompareExchange busy gate stops the two doubling up |
MainWindow PLC auto-reprobe |
30 s (PlcReprobeIntervalMs, MainWindow.xaml.cs:62) |
Yes — reachability probe, then restarts monitoring |
TrendingDataService |
2 s (PollIntervalMs = 2000, TrendingDataService.cs:32) |
Yes — constructs its own PlcTagReader per non-snapshot tag on every tick |
InventoryEventCaptureService |
1 s (InventoryEventCaptureService.cs:133) |
Mostly no — normally reads only PcReadIntegerCache; on the PC_Read_Integer[102].4 request bit it does real I/O (read stamps, write ack, poll for clear at a 100 ms PollInterval, :23) |
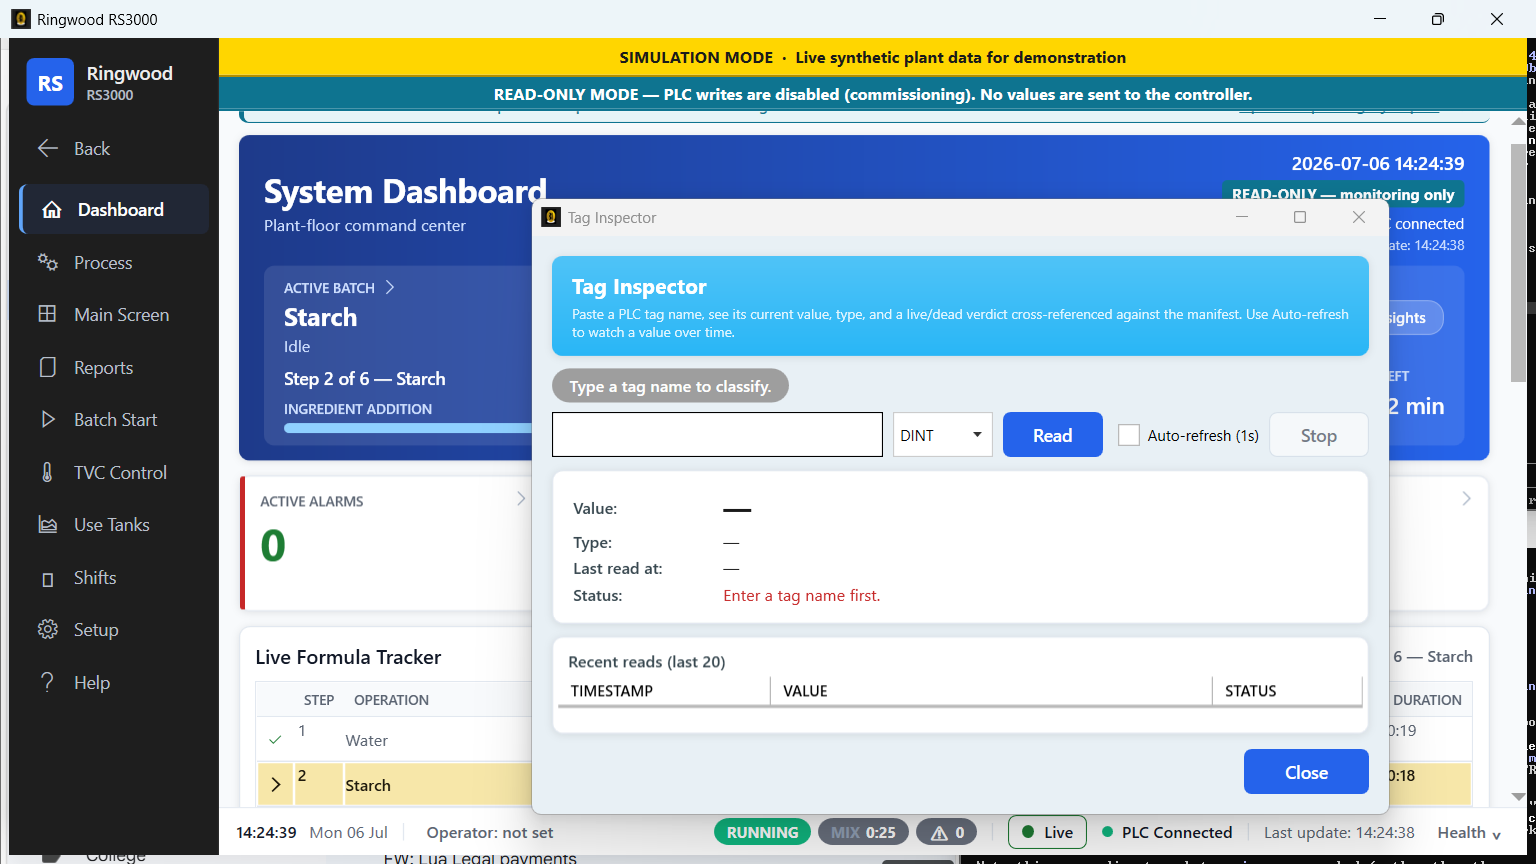
TagInspector (Setup screen) |
1 s (TagInspector.xaml.cs:60-62) |
Yes — builds a live PlcTagReader per refresh |
InventoryEditScreen |
60 s (InventoryPlcRefreshInterval, InventoryEditScreen.xaml.cs:25) |
Yes — inventory slice read |
ViscometerLiveRecorder |
5 s (TickInterval, ViscometerLiveRecorder.cs:33) |
No — consumes PcReadFloatSnapshot / PcReadIntegerSnapshot and writes a SQLite row |
The ViscometerLiveRecorder row is worth calling out because older documents
list it as a PLC timer. It is not: its class doc and its tick body only read
published snapshots. (ARCHITECTURE.md §3 already carries this retraction.)
Consolidating these under the coordinator is on the deferred-debt list
(ARCHITECTURE.md),
explicitly parked until after the cutover.
3.4 Snapshots, holders and caches#
The pattern is uniform: a poller builds an immutable snapshot and publishes it into a static holder; screens pull from the holder on their own timer.
| Holder | Type | File |
|---|---|---|
StorageTanksSnapshotHolder |
StorageTanksSnapshot |
StorageTanksSnapshot.cs:100 |
UseTanksSnapshotHolder |
UseTanksSnapshot |
UseTanksSnapshot.cs:101 |
TVCSnapshotHolder |
TVCSnapshot |
TVCSnapshot.cs:100 |
BatchStepsSnapshotHolder |
BatchStepsSnapshot |
BatchStepsSnapshot.cs:65 |
BatchStartSnapshotHolder |
BatchStartSnapshot |
BatchStartSnapshot.cs:195 |
PcReadIntegerCache |
PcReadIntegerSnapshot |
PcReadIntegerCache.cs |
PcReadFloatSnapshot (static block, not a holder type) |
float[35] |
PcReadFloatSnapshot.cs |
PcDisplayOutputsCache |
PcDisplayOutputsSnapshot |
PcDisplayOutputsCache.cs |
MakeReadyTankPlcData |
static fields | MakeReadyTankPlcData.cs |
There is no push, no event bus, and no binding to a poller. Concretely, the sequence for one tank temperature is:
controller value changes
   │  (up to one poller period)      StorageTankGroupPoller tick, 2000 ms
   ▼
StorageTanksSnapshot (immutable, stamped CapturedUtc)
   │  published into
   ▼
StorageTanksSnapshotHolder.Latest       ← static, lock-protected
   │  (up to one screen period)      screen DispatcherTimer, typically 1000 ms
   ▼
named control on the screen
Worst-case staleness is the number people get wrong, because it is poller cadence plus screen cadence, not just the poller's own number — and one poller's worst case, with a failed tick, is close to the freshness window built to cover it:
End-to-end latency is therefore poller cadence + screen cadence, worst case, plus the read itself:
| Source | Poller | Screen | Worst-case age on screen |
|---|---|---|---|
PC_Read_Float fast block |
500 ms | ~1000 ms | ~1.5 s (5.5 s in backoff) |
| Storage / Use tank / TVC / Batch steps / Batch start | 2000 ms | ~1000 ms | ~3 s |
PC_Read_Integer full block |
5000 ms | ~1000 ms | ~6 s — and ~11 s if one tick failed |
That last row is why MakeReadyTankViewModel.PcReadFreshnessWindow is 12
seconds and not something tighter: it has to cover a 5000 ms cadence one
failed tick deep. If you tighten a freshness window, check it against the
cadence and the backoff of the poller that feeds it.
The pull model is a deliberate trade. It costs latency and buys three things: a screen can never be blocked by a PLC read, a slow screen can never back-pressure a poller, and a snapshot is immutable so a screen can never observe a half-updated set of values.
Freshness gating: the part that keeps a frozen screen honest#
A stale value that looks live is the failure mode these types exist to prevent, and the code goes to some length about it.
Snapshots carry CapturedUtc. Verified present on StorageTanksSnapshot,
UseTanksSnapshot (:44), TVCSnapshot (:44), BatchStepsSnapshot,
PcReadIntegerSnapshot (:25) and PcDisplayOutputsSnapshot.
Exactly one snapshot carries no timestamp:
BatchStartSnapshot#
TVCSnapshotcarriesCapturedUtc. It is declared atRing/Services/PLC/TVCSnapshot.cs:44, defaulted toDateTime.UtcNowat construction in both constructors (:47,:59), and its own doc comment says why it was added: "MirrorsStorageTanksSnapshot.CapturedUtc— added so a consumer can tell a LIVE heat call from a frozen one after the TVC poller stops (the Live Process overview's heat leg)." It also gainedHasAnyData(:62) for the all-reads-failed case.BatchStartSnapshotgenuinely has none. A search forCapturedUtcor anyDateTimemember inRing/Services/PLC/BatchStartSnapshot.csreturns nothing.The asymmetry is real and worth knowing: a Batch Start screen cannot freshness-gate what it displays, while every other snapshot in this table can.
Freshness math is monotonic-hardened. PcReadIntegerSnapshot.IsFresh
(:89-104) and PcReadFloatSnapshot.IsFastBlockFresh (PcReadFloatSnapshot.cs)
both age against the greater of a Stopwatch elapsed and the wall-clock
delta. The reason is specific: a supervisor can set the LCP clock from
Setup → Update Processor Time/Date, and a backward step would otherwise
future-date the stamp and make a frozen block read as live. A forward step only
errs toward "stale", which is the safe direction.
"Refreshed low words only" is a distinct state.
PcReadIntegerSnapshot.RefreshedLowWordsOnly (:32) exists so a high-index
consumer (the inventory notify bit at word 102, for instance) cannot be fooled
by a snapshot whose CapturedUtc is recent but whose high words were not
re-read. IsFresh(maxAge, highestIndexNeeded) (:114-119) is the overload that
respects it. Use that overload for anything above index 31.
"All reads failed" must not advance the clock. TVCSnapshot.HasAnyData
(:62-...) and StorageTanksSnapshot.HasAnyData return false when every slot
field came back null — "exactly the frozen-but-looks-live case the staleness
gates exist to expose".
Consumers refuse rather than display stale.
MakeReadyTankViewModel.PcReadFreshnessWindow is 12 s;
ProcessHistorianService drops a whole sample set classified Dead;
Ring/Services/Display/DataFreshnessClassifier.cs is the shared classification
used by the freshness converters in Ring/Converters/.
3.5 The index maps#
Two small, load-bearing constant files.
Ring/Services/PLC/PcReadIndexes.cs — PC_Read_Integer[0..479]
(ElementCount = 480, :12):
| Constant | Index | Meaning |
|---|---|---|
HeartbeatIndex |
0 | link heartbeat word |
BatchCurrentStepNumber |
1 | |
BatchCurrentIngredientCode |
2 | |
BatchIngredientProgressPercent |
3 | |
BatchMixProgressPercent |
4 | |
BatchMixCountdown |
5 | displayed as m:ss |
BatchFormulaNameCode |
7 | |
BatchStorageTankCode |
8 | destination tank attribution |
SystemStatusWord (alias MixerSystemStatusWord) |
9 | 0 = idle, 1 = HOLD, 2 = running |
InventorySnapshotNotificationWord / …Bit |
102 / bit 4 | PLC signals a new inventory snapshot |
SystemStatusWord is decoded read-only by
Ring/Services/PLC/SystemStatusWord.cs, which owns the Process-menu command
policy (ResumeCommandVisible / ResetCommandVisible, consumed at
Ring/Views/UserControls/NavBar.xaml.cs:3430-3436). Its L5K provenance is
quoted verbatim in the constant's doc comment — HOLD wins over running.
Ring/Services/PLC/PcWriteIndexes.cs is deliberately tiny: it holds only
InventorySnapshotAckWord = 27 / InventorySnapshotAckBit = 4. The other
PC_Write_Integer bit addresses live with the services that own them
(PcWriteInteger30BatchControlPlcService, ShiftControlPlcService,
ProcessorTimeDatePlcService) — see chapter 04.
PcReadFloatSnapshot carries the float-block map inline: FastBlockLength = 35
(indices 0–34), MixerWeightIndex = 30, MixerTemperatureIndex = 31,
BoraxCausticWeightIndex = 32, ViscosityResultIndex = 33 (PLC-computed
result), ViscosityRawInputIndex = 34 (raw Cambridge analog input).
3.6 Heartbeat and connection state#
Ring/Services/PLC/PlcHeartbeatConnectionTracker.cs is the single source of
link truth. It watches PC_Read_Integer[0], which the ladder increments.
All timing is monotonic#
Every elapsed calculation runs off Stopwatch ticks through
MonotonicNowTicks (:60, a test seam) and MonoElapsed (:63-73). UTC
stamps exist for display only (LastSuccessUtc, the banner) and are
explicitly documented as such at :41-46. A wall-clock step — NTP, or a
supervisor setting the LCP clock mid-batch — therefore cannot fake liveness or
suppress comms-loss detection.
The state machine#
| State | Entered when | Threshold constant |
|---|---|---|
Unknown |
before the first poll, and after Reset() |
— |
Connecting |
a poll failed but the failure count is below the disconnect threshold | — |
Connected |
the heartbeat value changed on this poll, or has changed within the last 4 s | StaleHeartbeatAfter (:97) |
Stale |
heartbeat unchanged for more than 4 s | StaleHeartbeatAfter |
Starved |
heartbeat unchanged for more than 12 s while reads still succeed | HeartbeatUnchangedStarvedAfter (:105) |
Disconnected |
12 s of no successful read, or 3 consecutive read failures | SilenceDisconnectAfter (:98), FailuresBeforeDisconnected = 3 (:106) |
The classification is factored into two pure, unit-testable functions:
ClassifyHeldHeartbeat(TimeSpan) (:80-87) and
ShouldDisconnectOnSilence(TimeSpan) (:94-95).
Starved deserves its own state because it is the diagnosis operators
need: the network is fine, Ring is fine, and the controller is not advancing the
heartbeat. Pre-cutover the usual cause is MainTask InhibitTask := Yes; the
post-cutover meaning is "PLC reachable but wedged"
(Ring/Services/PLC/PlcConnectionState.cs).
Two questions, two answers#
AllowHeavyPlcPolling()  // Connected OR Stale        (:127-135)
AllowPlcWrites()        // Connected only            (:143-150)
The asymmetry is deliberate and documented in place: Stale is a 4 s blip, and
gating heavy polling off it "froze EVERY tag group on one heartbeat hiccup
during a live batch". But Stale is not proof the controller scan is
advancing, so writes wait. AllowPlcWrites() is layer 4 of the write gate
stack — see chapter 04.
The escape hatch nobody should flip casually#
HeartbeatLinkLogicEnabled is a const bool = true (:33). Setting it false
makes CurrentState return Connected unconditionally,
AllowHeavyPlcPolling() and AllowPlcWrites() return true
unconditionally, and stops the heartbeat timer. It exists as a one-line debug
toggle for a controller known to have MainTask inhibited — every guarded
branch carries a #pragma warning disable CS0162 so the code stays compiled.
Flipping it disables a safety gate; treat it as a bench-only edit that must
never reach a release.
MarkDisconnected() (:172-183) lets startup force the banner honest after a
TCP probe fails, before any heartbeat poll has run.
3.7 Diagnostics around the link#
PlcCommunicationLogService (Ring/Services/PLC/PlcCommunicationLogService.cs)
— an in-memory ring buffer (MaxBufferedEvents = 500) plus optional per-day CSV
disk log of TX/RX events, wired into PlcTagReader.Read() and
PlcTagWriter.WriteCore() at their success/failure exit points. It backs the
DisplayCommunicationForm setup screen. Disk writes are drained by a single
batched writer task off the PLC thread, per-day CSVs older than the retention
window are pruned on day-rollover, and every logging call is swallowed by the
caller so a logging failure can never propagate into a PLC call.
Note that suppressed writes still produce a comm-log row, marked
"ReadOnly suppressed" (PlcTagWriter.cs:146) — so the form shows the call
that would have happened.
PlcCommEventLogService (Ring/Services/PLC/PlcCommEventLogService.cs) is
a different service that a name-grep will confuse with the one above — the
near-identical names (PlcCommunicationLogService vs. PlcCommEventLogService)
are a known trap. Where PlcCommunicationLogService (RCS-128, immediately
above) is an in-memory ring buffer plus optional per-day CSV of every
individual TX/RX tag call feeding the live DisplayCommunicationForm tail,
PlcCommEventLogService persists PLC connection-lifecycle events to a SQL
table, PlcCommunicationLog (schema v32,
Repositories/PlcCommunicationLogRepository.cs), so comms history survives a
restart and is queryable/exportable — a much lower event rate, aimed at
after-the-fact auditability rather than a live tail.
Its PlcCommEventType taxonomy: Connected, Disconnected,
HeartbeatStalled (heartbeat tracker transitions — §3.6), ReprobeStarted /
ReprobeSucceeded (the background auto-reprobe loop, §3.3), SessionError /
ReadFault (a read or write failure, split by a best-effort text
heuristic — PlcCommEventLogService.ClassifyReadFailure looks for the
substring "session" in the exception message; libplctag exposes no distinct
session-level error type, so this is documented as a heuristic, not a proven
libplctag error-code distinction), WriteAttempted / WriteBlocked /
WriteSucceeded / WriteFailed (the write outcome vocabulary), and
LogOverflow (one summary row per overflow episode, never one row per drop).
The design is hot-path-safe by construction: Record() only enqueues onto a
bounded ConcurrentQueue (MaxQueuedEvents, default 5000) and never touches
the database or blocks, so it is safe to call from a PLC read/write call site.
A single background writer task batches everything queued into one INSERT
transaction per flush; if the backlog ever exceeds the cap (a stuck/slow DB),
the oldest queued events are dropped to make room, and exactly one
LogOverflow row summarizes the drop count. Retention defaults to 90
days via PlcSettings.CommLogRetentionDays
(AppSettings.cs:551 — non-positive disables pruning), applied once at
startup and then daily.
PlcClockSkewMonitor (Ring/Services/PLC/PlcClockSkewMonitor.cs) — a
read-only sentinel. The PLC clock is set manually and the controller does not
observe Dutch daylight saving, while Ring reconstructs PLC-sourced stamps as
Windows-local. After each March/October transition the two are exactly an hour
apart until someone re-syncs. The monitor compares the reconstructed PLC-local
time of a freshly captured event against the PC clock at capture and, past
SignificantSkewMinutes = 2, logs a warning and raises a throttled line on the
PLC Health drawer. It writes nothing to the PLC. The skew math is pure and
unit-tested; the logging side is fire-and-forget.
PcWriteInteger30StrandedBitMonitor — a read-only sentinel for a stranded
command bit in PC_Write_Integer[30]. It belongs to the write story and is
covered in chapter 04, but it is a reader.
TagManifestService (Ring/Services/PLC/TagManifestService.cs) loads
scripts/live-tags.json, the manifest emitted by
scripts/Parse-L5kLiveTags.ps1. Its Live/Dead verdicts are sourced from the
2024 plaintext export and are therefore 2024-sourced and
non-authoritative for anything running today
(docs/PLC_FACTS.md). Treat a "dead" verdict as
"no writer was found in the parsed 2024 export", never as "the tag is dead in
the plant".
TagSuggestionCatalog feeds the Tag Inspector's autocomplete from the same
manifest.
3.8 Demo mode on the read path#
Demo mode is DemoMode.Enabled in configuration plus a restart. There is no CLI
flag (docs/CONFIG_AND_STARTUP.md §6).
It substitutes at two levels, and knowing which is which saves confusion:
DemoPlcTagReader(Ring/Services/PLC/DemoPlcTagReader.cs) is the seam insidePlcTagReader. The reader capturesDemoMode.Enabledonce at construction (PlcTagReader.cs:24-27, 41-45) — deliberately, "so a flip of the config mid-run does not cause one tag to half-substitute".DemoModeData(Ring/Services/PLC/DemoModeData.cs) is the substitute for everything that does not go throughPlcTagReader. The heavy pollers build raw libplctag tags directly, so without this "demo mode shows the banner but every tank/temperature/batch tile stays blank". Each poller callsDemoModeData.Enabled()and publishes a synthetic snapshot instead of touching the network. Values drift on a per-channel sine (Wave) so the dashboard looks alive; the plausible bands mirror the live plant (nominal tank ~1125 gal, temps ~95–105 °F).
DemoModeData.Enabled() is null-safe and never throws on a startup path
(DemoModeData.cs). On the write path the demo check is re-evaluated live at
the wire, not captured at construction — that difference is deliberate and is
explained in chapter 04.
3.9 What normal looks like#
Every cadence and mechanism above is documented; this section states what healthy looks like numerically, so a deviation is recognisable as a deviation rather than discovered by accident. Where a figure is a compiled constant, it is cited directly. Where it depends on field or soak evidence that changes over time, this section links to the document that owns the number rather than freezing it here — per this book's own rule (README §How to use this book, item 2).
| Signal | Expected steady state | Where to observe it | What a deviation usually means |
|---|---|---|---|
| Poll cycle duration vs. budget | Each poller has its own interval and read-timeout budget — e.g. PlcSnapshotPoller 500 ms interval / 2000 ms read timeout; the PC_Read_Integer full block 5000 ms interval / 3000 ms bulk timeout, 1500 ms indexed fallback timeout. Full table: §3.2 |
PlcCommunicationLogService's comm log (per-tag TX/RX with duration); the PLC Health drawer |
A cycle that regularly approaches its timeout, without yet failing, is the leading indicator of session pressure — it usually means something else is also holding EIP sessions against this controller (see the row below) |
| Heartbeat poll rate (Ring → controller) | Ring polls PC_Read_Integer[0] every 1500 ms (PcReadIntegerPoller.cs:56; PlcPollingCoordinator.cs:149) |
The Connected/Stale/Starved state in the PLC Health drawer; §3.6 |
Stale for more than a few cycles with reads still succeeding is Starved — the network and Ring are fine, the controller's own scan is not advancing the word. Ring's poll cadence is code-verified; how fast the controller's own ladder increments the word is a ladder-side fact this book does not have a citation for — do not infer a controller-side rate from Ring's poll interval |
| Historian sampling and growth | One ProcessHistorySample row per installed tank per 60 s (ProcessHistorianService.cs, DefaultCadenceMs = 60_000) — arithmetic on that cadence is ≈525,600 rows/tank/year, so a 6–12 tank plant accumulates on the order of 3.2–6.3M rows/year at the retention window's default length. Retention is Database.ProcessHistorianRetentionDays (Setup → Database Backup/Restore → Data retention; default 365 days, 0 = keep forever) — not the ProcessHistorianService.DefaultRetentionDays = 30 constant this row cited before 2026-09-01; that constant is now only the fallback when DI supplies no configured value, and the shipped app always supplies one |
chapter 05 §5.7 | No code-level source computes expected .db file growth in MB/day — the row-count above is arithmetic on the sampling cadence, not a measured figure, and no soak document reviewed for this book reports a byte-size number either. IX_ProcessHistory_Captured and IX_ProcessHistory_Tank_Captured (ProcessHistoryRepository.cs) keep date-ranged report queries seeking rather than scanning at this row count, so query latency is not the growth concern; if disk headroom is the question, measure RingwoodDatabase.db's size on your own install over a known number of days rather than trusting a number in prose |
| Memory / working set over a shift | No code-level source — DiagnosticConsole reads and displays Process.WorkingSet64 but nothing in Ring/ declares an expected range or an alert threshold |
Setup → Diagnostic Console | The only soak observation in the repository as of this writing is a single ~6 h Debug-build run against the bundled simulator (working set fell 172 MB → 77 MB over the run, "healthy GC, no leak signature") — see docs/production-readiness/RELEASE_PACKAGE_VERIFY_2026-07-30.md §5. That document and docs/production-readiness/REMAINING_WORK_TO_CUTOVER_2026-06-22.md both record that the required 48–72 h Release-build soak against real hardware had not yet run. Treat the 6 h figure as evidence of no obvious leak, not as a production baseline |
| Concurrent EIP session headroom | A CompactLogix caps at roughly 4–8 EtherNet/IP sessions per source IP (docs/PLC_FACTS.md; corroborated in code at UdtTankReader.cs:97) |
A burst of ErrorTimeout across multiple readers at once, with no single poller implicated |
Ring's own seven pollers plus any field script opening a session from the same machine share this ceiling. The condition is self-healing — field evidence puts recovery at roughly 30 s after the extra sessions close (docs/production-readiness/FIELD_SESSION_RUNBOOK_2026-06-29.md:62) |
Next: 04 — The Write Path and Safety Model.
Verified against#
Every claim in this chapter was read out of these files on 2026-09-01:
Ring/Services/PLC/ — PlcTagReader.cs, PlcPollingCoordinator.cs,
PlcSnapshotPoller.cs, PcReadIntegerPoller.cs, BatchStepsPoller.cs,
StorageTankGroupPoller.cs, UseTankGroupPoller.cs, TVCPoller.cs,
BatchStartPoller.cs, StorageTankTagReaderService.cs,
UseTankTagReaderService.cs, TVCTagReaderService.cs,
BatchTagReaderService.cs, UdtTankLayout.cs, PcReadIndexes.cs,
PcWriteIndexes.cs, PcReadIntegerCache.cs, PcReadIntegerSnapshot.cs,
PcReadFloatSnapshot.cs, PcDisplayOutputsCache.cs, StorageTanksSnapshot.cs,
UseTanksSnapshot.cs, TVCSnapshot.cs, BatchStepsSnapshot.cs,
BatchStartSnapshot.cs, PlcHeartbeatConnectionTracker.cs,
PlcConnectionState.cs, PlcCommunicationLogService.cs,
PlcCommEventLogService.cs, PlcCommEventType.cs,
PlcClockSkewMonitor.cs, TagManifestService.cs, DemoModeData.cs,
DemoPlcTagReader.cs, TrendingDataService.cs,
InventoryEventCaptureService.cs, ViscometerLiveRecorder.cs ·
Ring/Views/MainWindow.xaml.cs · Ring/Views/Setup/TagInspector.xaml.cs ·
Ring/Views/Setup/InventoryEditScreen.xaml.cs ·
Ring/Services/PLC/UdtTankReader.cs · Ring/Services/ProcessHistorianService.cs ·
Ring/Views/Setup/DiagnosticConsole.xaml.cs ·
Ring/Database/Repositories/PlcCommunicationLogRepository.cs,
Ring/Database/Repositories/ProcessHistoryRepository.cs (ApplyRetentionDays
no-op on non-positive input; IX_ProcessHistory_Captured,
IX_ProcessHistory_Tank_Captured) ·
Ring/Database/DatabaseInitializer.cs (schema v32) ·
Ring/Infrastructure/Configuration/AppSettings.cs (CommLogRetentionDays,
:548-551; Database.ProcessHistorianRetentionDays default 365, :360) ·
Ring/Infrastructure/Configuration/DataRetentionConfigWriter.cs ·
docs/PLC_FACTS.md ·
docs/production-readiness/RELEASE_PACKAGE_VERIFY_2026-07-30.md ·
docs/production-readiness/REMAINING_WORK_TO_CUTOVER_2026-06-22.md ·
docs/production-readiness/FIELD_SESSION_RUNBOOK_2026-06-29.md ·
ARCHITECTURE.md